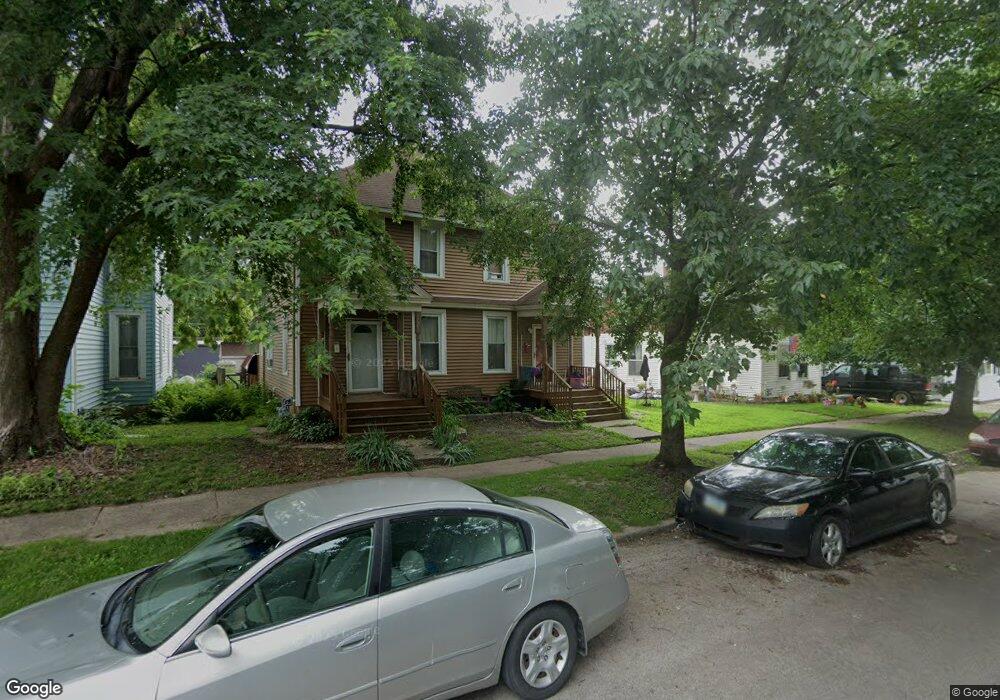
1723 W 6th St Davenport, IA 52802
Riverview Terrace NeighborhoodEstimated Value: $88,000 - $120,000
6
Beds
2
Baths
2,343
Sq Ft
$44/Sq Ft
Est. Value
About This Home
This home is located at 1723 W 6th St, Davenport, IA 52802 and is currently estimated at $102,560, approximately $43 per square foot. 1723 W 6th St is a home located in Scott County with nearby schools including Walnut Hill Elementary School, South Christian Elementary School, and Christian County Middle School.
Ownership History
Date
Name
Owned For
Owner Type
Purchase Details
Closed on
Feb 9, 2016
Sold by
White Brian T
Bought by
White B Llc
Current Estimated Value
Purchase Details
Closed on
Jan 14, 2008
Sold by
Hsbc Mortgage Services
Bought by
White Brian T
Home Financials for this Owner
Home Financials are based on the most recent Mortgage that was taken out on this home.
Original Mortgage
$41,000
Interest Rate
6.17%
Mortgage Type
Purchase Money Mortgage
Purchase Details
Closed on
Jun 27, 2007
Sold by
Fisher Penny and Fisher Randall
Bought by
Hsbc Mortgage Services
Purchase Details
Closed on
Aug 1, 2005
Sold by
White Thomas L and White Pamela S
Bought by
Fisher Penny L
Home Financials for this Owner
Home Financials are based on the most recent Mortgage that was taken out on this home.
Original Mortgage
$65,000
Interest Rate
11.35%
Mortgage Type
Adjustable Rate Mortgage/ARM
Create a Home Valuation Report for This Property
The Home Valuation Report is an in-depth analysis detailing your home's value as well as a comparison with similar homes in the area
Home Values in the Area
Average Home Value in this Area
Purchase History
| Date | Buyer | Sale Price | Title Company |
|---|---|---|---|
| White B Llc | -- | None Available | |
| White Brian T | $25,000 | None Available | |
| Hsbc Mortgage Services | $16,212 | None Available | |
| Fisher Penny L | $65,000 | None Available |
Source: Public Records
Mortgage History
| Date | Status | Borrower | Loan Amount |
|---|---|---|---|
| Previous Owner | White Brian T | $41,000 | |
| Previous Owner | Fisher Penny L | $65,000 |
Source: Public Records
Tax History Compared to Growth
Tax History
| Year | Tax Paid | Tax Assessment Tax Assessment Total Assessment is a certain percentage of the fair market value that is determined by local assessors to be the total taxable value of land and additions on the property. | Land | Improvement |
|---|---|---|---|---|
| 2025 | $1,344 | $86,040 | $10,130 | $75,910 |
| 2024 | $1,312 | $75,200 | $10,130 | $65,070 |
| 2023 | $1,216 | $75,200 | $10,130 | $65,070 |
| 2022 | $1,910 | $56,970 | $7,200 | $49,770 |
| 2021 | $1,222 | $56,970 | $7,200 | $49,770 |
| 2020 | $2,075 | $50,810 | $7,200 | $43,610 |
| 2019 | $2,620 | $50,810 | $7,200 | $43,610 |
| 2018 | $2,305 | $50,810 | $7,200 | $43,610 |
| 2017 | $1,388 | $50,810 | $7,200 | $43,610 |
| 2016 | $1,951 | $50,490 | $0 | $0 |
| 2015 | $1,106 | $46,610 | $0 | $0 |
| 2014 | $1,036 | $46,610 | $0 | $0 |
| 2013 | $1,018 | $0 | $0 | $0 |
| 2012 | -- | $52,150 | $6,790 | $45,360 |
Source: Public Records
Map
Nearby Homes
- 1727 W 6th St
- 1717 W 6th St
- 1711 W 6th St
- 515 N Division St
- 1709 W 6th St
- 1724 W 6th St
- 1724 W 6th St Unit 26
- 1703 W 6th St
- 511 N Division St
- 1722 W 6th St
- 1716 W 6th St
- 526 N Division St
- 528 N Division St
- 522 N Division St
- 1730 W 6th St
- 514 N Division St
- 1710 W 6th St
- 604 Madison St
- 1708 W 6th St
- 602 N Division St