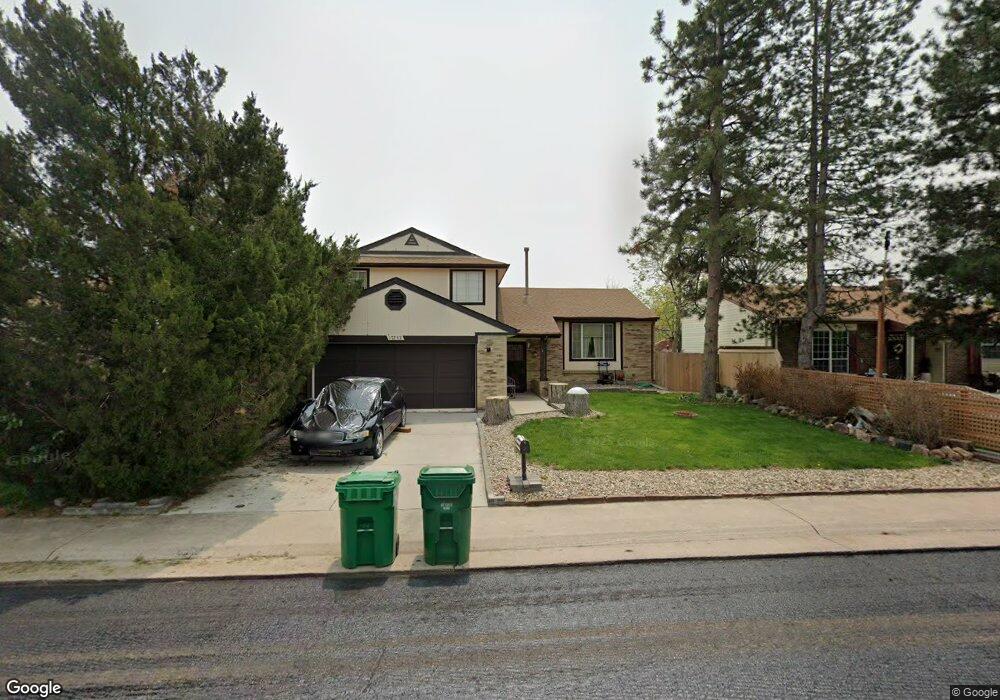
17232 E Progress Cir S Centennial, CO 80015
Smoky Hill NeighborhoodEstimated Value: $489,313 - $514,000
3
Beds
3
Baths
1,662
Sq Ft
$301/Sq Ft
Est. Value
About This Home
This home is located at 17232 E Progress Cir S, Centennial, CO 80015 and is currently estimated at $500,328, approximately $301 per square foot. 17232 E Progress Cir S is a home located in Arapahoe County with nearby schools including Trails West Elementary School, Falcon Creek Middle School, and Grandview High School.
Ownership History
Date
Name
Owned For
Owner Type
Purchase Details
Closed on
Jun 20, 2023
Sold by
Toumanian Rolan
Bought by
Progress Cor Llc
Current Estimated Value
Purchase Details
Closed on
Jul 27, 2021
Sold by
Toumanian Rolan
Bought by
Toumanian Rolan and R & R Toumantan Living Trust
Purchase Details
Closed on
Jul 12, 2021
Sold by
Toumanian Vladimir
Bought by
Toumanian Rolan
Purchase Details
Closed on
May 22, 2017
Sold by
Toumanian Vladimir
Bought by
Toumanian Vladimir and Toumanian Rolan
Purchase Details
Closed on
Oct 21, 1998
Sold by
Gardenswartz Neil
Bought by
Toumanian Vladimir
Home Financials for this Owner
Home Financials are based on the most recent Mortgage that was taken out on this home.
Original Mortgage
$138,220
Interest Rate
6.61%
Purchase Details
Closed on
Jun 1, 1979
Sold by
Conversion Arapco
Bought by
Conversion Arapco
Purchase Details
Closed on
Jul 4, 1776
Bought by
Conversion Arapco
Create a Home Valuation Report for This Property
The Home Valuation Report is an in-depth analysis detailing your home's value as well as a comparison with similar homes in the area
Home Values in the Area
Average Home Value in this Area
Purchase History
| Date | Buyer | Sale Price | Title Company |
|---|---|---|---|
| Progress Cor Llc | -- | None Listed On Document | |
| Toumanian Rolan | -- | None Available | |
| Toumanian Rolan | -- | None Available | |
| Toumanian Vladimir | -- | None Available | |
| Toumanian Vladimir | $142,500 | Heritage Title | |
| Conversion Arapco | -- | -- | |
| Conversion Arapco | -- | -- |
Source: Public Records
Mortgage History
| Date | Status | Borrower | Loan Amount |
|---|---|---|---|
| Previous Owner | Toumanian Vladimir | $138,220 |
Source: Public Records
Tax History
| Year | Tax Paid | Tax Assessment Tax Assessment Total Assessment is a certain percentage of the fair market value that is determined by local assessors to be the total taxable value of land and additions on the property. | Land | Improvement |
|---|---|---|---|---|
| 2025 | $3,906 | $28,244 | -- | -- |
| 2024 | $3,527 | $32,596 | -- | -- |
| 2023 | $3,527 | $32,596 | $0 | $0 |
| 2022 | $2,769 | $24,756 | $0 | $0 |
| 2021 | $2,885 | $24,756 | $0 | $0 |
| 2020 | $2,734 | $24,353 | $0 | $0 |
| 2019 | $2,650 | $24,353 | $0 | $0 |
| 2018 | $2,436 | $20,362 | $0 | $0 |
| 2017 | $2,399 | $20,362 | $0 | $0 |
| 2016 | $2,293 | $18,610 | $0 | $0 |
| 2015 | $2,222 | $18,610 | $0 | $0 |
| 2014 | $1,734 | $13,421 | $0 | $0 |
| 2013 | -- | $14,130 | $0 | $0 |
Source: Public Records
Map
Nearby Homes
- 5229 S Pagosa Way
- 17477 E Belleview Place
- 5378 S Sedalia Ct
- 17529 E Crestridge Ave
- 5118 S Pagosa St
- 5134 S Ouray Ct
- 5138 S Sedalia Ct
- 5017 S Quintero Cir
- 17013 E Berry Place
- 16991 E Chenango Ave Unit A
- 16971 E Chenango Ave Unit A
- 17496 E Grand Dr
- 5101 S Olathe Cir
- 17954 E Progress Place
- 16923 E Whitaker Dr Unit B
- 17721 E Grand Ave
- 17562 E Whitaker Dr
- 17419 E Whitaker Dr
- 4823 S Pagosa Way
- 18020 E Bellewood Dr
- 17252 E Progress Cir S
- 17180 E Progress Cir S
- 5308 S Quintero Ct
- 17160 E Progress Cir S
- 17272 E Progress Cir S
- 5318 S Quintero Ct
- 5233 S Richfield St
- 5317 S Quintero Ct
- 5233 S Quintero Ct
- 5234 S Quintero Ct
- 17169 E Progress Cir S
- 5243 S Richfield St
- 17140 E Progress Cir S
- 5316 S Quintero St
- 5203 S Richfield St
- 17139 E Progress Cir S
- 5338 S Quintero Ct
- 5337 S Quintero Ct
- 5223 S Quintero Ct
- 5253 S Richfield St
Your Personal Tour Guide
Ask me questions while you tour the home.