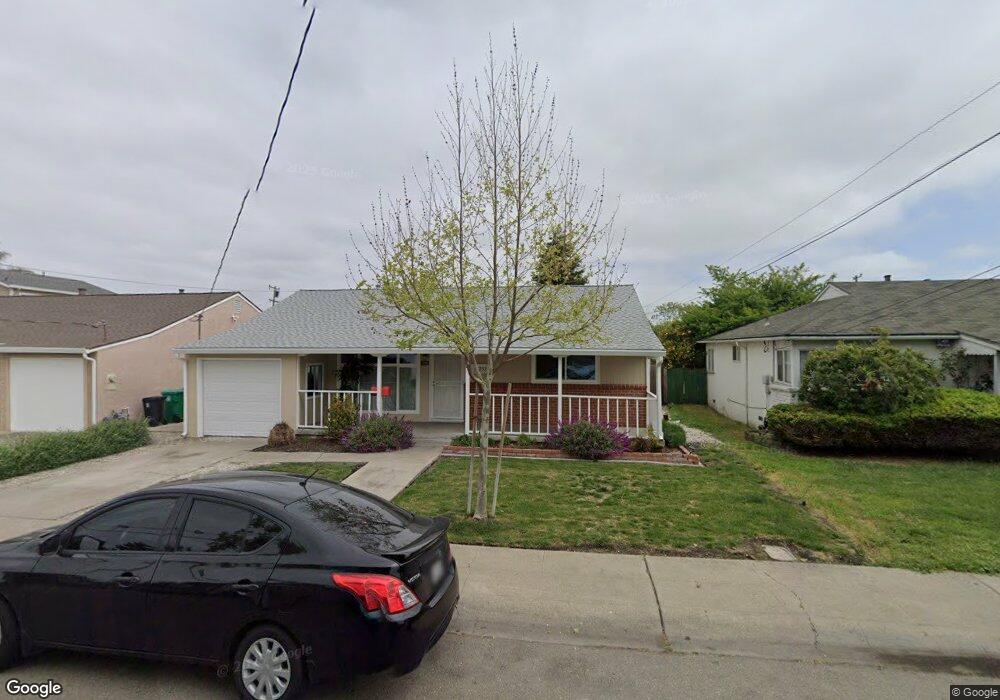
17232 Via Del Rey San Lorenzo, CA 94580
Estimated Value: $870,000 - $999,000
4
Beds
2
Baths
1,865
Sq Ft
$505/Sq Ft
Est. Value
About This Home
This home is located at 17232 Via Del Rey, San Lorenzo, CA 94580 and is currently estimated at $941,118, approximately $504 per square foot. 17232 Via Del Rey is a home located in Alameda County with nearby schools including Del Rey Elementary School, Bohannon Middle School, and Arroyo High School.
Ownership History
Date
Name
Owned For
Owner Type
Purchase Details
Closed on
Feb 24, 2004
Sold by
Lovre Sophia
Bought by
Lovre 1997 Trust
Current Estimated Value
Purchase Details
Closed on
Aug 27, 2002
Sold by
Magpoc Teresa T
Bought by
Lovre Sophia
Home Financials for this Owner
Home Financials are based on the most recent Mortgage that was taken out on this home.
Original Mortgage
$260,000
Interest Rate
6.29%
Purchase Details
Closed on
Oct 18, 1995
Sold by
Claypool Gilvin L and Claypool Lillian
Bought by
Magpoc Jose C and Magpoc Teresa T
Home Financials for this Owner
Home Financials are based on the most recent Mortgage that was taken out on this home.
Original Mortgage
$172,500
Interest Rate
7.67%
Mortgage Type
Seller Take Back
Create a Home Valuation Report for This Property
The Home Valuation Report is an in-depth analysis detailing your home's value as well as a comparison with similar homes in the area
Home Values in the Area
Average Home Value in this Area
Purchase History
| Date | Buyer | Sale Price | Title Company |
|---|---|---|---|
| Lovre 1997 Trust | -- | -- | |
| Lovre Sophia | $360,000 | Fidelity National Title Co | |
| Magpoc Jose C | $185,000 | North American Title Co |
Source: Public Records
Mortgage History
| Date | Status | Borrower | Loan Amount |
|---|---|---|---|
| Previous Owner | Lovre Sophia | $260,000 | |
| Previous Owner | Magpoc Jose C | $172,500 | |
| Closed | Magpoc Jose C | $1,000 |
Source: Public Records
Tax History Compared to Growth
Tax History
| Year | Tax Paid | Tax Assessment Tax Assessment Total Assessment is a certain percentage of the fair market value that is determined by local assessors to be the total taxable value of land and additions on the property. | Land | Improvement |
|---|---|---|---|---|
| 2025 | $6,864 | $521,351 | $156,405 | $364,946 |
| 2024 | $6,864 | $511,131 | $153,339 | $357,792 |
| 2023 | $6,832 | $501,111 | $150,333 | $350,778 |
| 2022 | $6,731 | $491,287 | $147,386 | $343,901 |
| 2021 | $6,548 | $481,657 | $144,497 | $337,160 |
| 2020 | $6,407 | $476,721 | $143,016 | $333,705 |
| 2019 | $6,417 | $467,377 | $140,213 | $327,164 |
| 2018 | $6,064 | $458,214 | $137,464 | $320,750 |
| 2017 | $5,788 | $449,232 | $134,769 | $314,463 |
| 2016 | $5,523 | $440,427 | $132,128 | $308,299 |
| 2015 | $5,404 | $433,814 | $130,144 | $303,670 |
| 2014 | $5,325 | $425,317 | $127,595 | $297,722 |
Source: Public Records
Map
Nearby Homes
- 1608 Keller Ave
- 17354 Via el Cerrito
- 1575 Via Lucas
- 1311 Via Manzanas
- 1867 Via Buena Vista
- 1766 Via Redondo
- 18005 Sunol Rd
- 1631 Via Ventana
- 16050 Via Olinda
- 18003 Incline Place
- 17316 Via Flores
- 1655 Via Escondido
- 819 Bockman Rd
- 17347 Via Encinas
- 18018 Sahara Rd
- 16011 Via Conejo
- 0 E 14th St Unit 41059501
- 18251 Via Jose
- 17761 Via Arriba
- 1781 Via Rancho
- 17238 Via Del Rey
- 17226 Via Del Rey
- 17244 Via Del Rey
- 17220 Via Del Rey
- 17239 Via la Jolla
- 17227 Via la Jolla
- 17245 Via la Jolla
- 17221 Via la Jolla
- 17250 Via Del Rey
- 17214 Via Del Rey
- 17219 Via Del Rey
- 17237 Via Del Rey
- 17237 Via Del Rey
- 17231 Via Del Rey
- 17251 Via la Jolla
- 17215 Via la Jolla
- 17243 Via Del Rey
- 17243 Via Del Rey
- 17225 Via Del Rey
- 17225 Via Del Rey