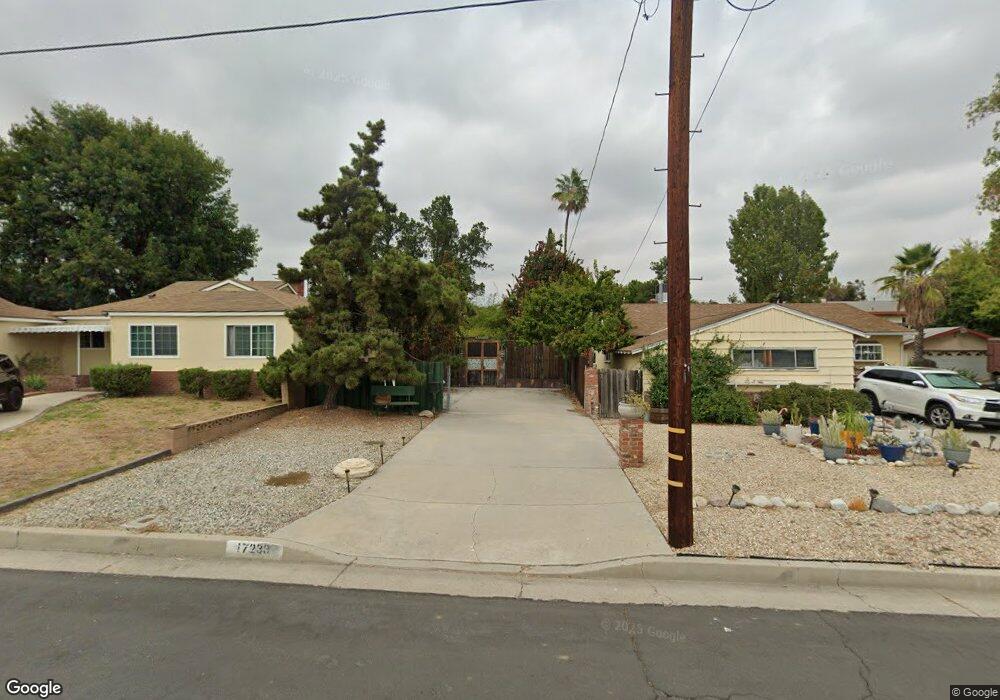
17233 Germain St Granada Hills, CA 91344
Estimated Value: $995,000 - $1,136,000
3
Beds
2
Baths
1,724
Sq Ft
$605/Sq Ft
Est. Value
About This Home
This home is located at 17233 Germain St, Granada Hills, CA 91344 and is currently estimated at $1,042,324, approximately $604 per square foot. 17233 Germain St is a home located in Los Angeles County with nearby schools including Granada Elementary School for Advanced Studies, Patrick Henry Middle School, and Valley Academy of Arts & Sciences.
Ownership History
Date
Name
Owned For
Owner Type
Purchase Details
Closed on
Feb 7, 2008
Sold by
Thatcher Joel and Thatcher Geneva
Bought by
Nahman Peter
Current Estimated Value
Home Financials for this Owner
Home Financials are based on the most recent Mortgage that was taken out on this home.
Original Mortgage
$377,600
Outstanding Balance
$232,896
Interest Rate
5.64%
Mortgage Type
Purchase Money Mortgage
Estimated Equity
$809,428
Purchase Details
Closed on
Oct 27, 1995
Sold by
Mcmullen Winston L and The Winston L Mcmullen Trust O
Bought by
Thatcher Joel and Thatcher Geneva
Home Financials for this Owner
Home Financials are based on the most recent Mortgage that was taken out on this home.
Original Mortgage
$156,750
Interest Rate
6.99%
Purchase Details
Closed on
Jun 23, 1994
Sold by
Mcmullen Winston
Bought by
Mcmullen Winston L and Winston L Mcmullen Trust Of 1994
Create a Home Valuation Report for This Property
The Home Valuation Report is an in-depth analysis detailing your home's value as well as a comparison with similar homes in the area
Home Values in the Area
Average Home Value in this Area
Purchase History
| Date | Buyer | Sale Price | Title Company |
|---|---|---|---|
| Nahman Peter | $472,000 | Fidelity Van Nuys | |
| Thatcher Joel | $165,000 | Stewart Title | |
| Mcmullen Winston L | -- | -- |
Source: Public Records
Mortgage History
| Date | Status | Borrower | Loan Amount |
|---|---|---|---|
| Open | Nahman Peter | $377,600 | |
| Previous Owner | Thatcher Joel | $156,750 |
Source: Public Records
Tax History Compared to Growth
Tax History
| Year | Tax Paid | Tax Assessment Tax Assessment Total Assessment is a certain percentage of the fair market value that is determined by local assessors to be the total taxable value of land and additions on the property. | Land | Improvement |
|---|---|---|---|---|
| 2025 | $6,136 | $491,790 | $343,867 | $147,923 |
| 2024 | $6,136 | $482,148 | $337,125 | $145,023 |
| 2023 | $6,021 | $472,695 | $330,515 | $142,180 |
| 2022 | $5,749 | $463,428 | $324,035 | $139,393 |
| 2021 | $5,673 | $454,342 | $317,682 | $136,660 |
| 2019 | $5,508 | $440,867 | $308,260 | $132,607 |
| 2018 | $5,324 | $432,223 | $302,216 | $130,007 |
| 2016 | $5,077 | $415,441 | $290,482 | $124,959 |
| 2015 | $5,003 | $409,201 | $286,119 | $123,082 |
| 2014 | $5,027 | $401,186 | $280,515 | $120,671 |
Source: Public Records
Map
Nearby Homes
- 17222 Kingsbury St
- 17230 Chatsworth St Unit 1
- 17175 Chatsworth St
- 17317 Los Alimos St
- 10415 Wish Ave
- 17520 Kingsbury St
- 10452 Balboa Blvd
- 16940 Chatsworth St Unit 208
- 17257 Horace St
- 17068 Celtic St
- 17623 Clymer St
- 10501 Forbes Ave
- 17043 Celtic St
- 17559 Devonshire St
- 16857 Chatsworth St
- 17641 Los Alimos St
- 10132 Wish Ave
- 10111 Oak Park Ave
- 16870 Tulsa St
- 17062 San Fernando Mission Blvd
- 17229 Germain St
- 17237 Germain St
- 17227 Germain St
- 10614 Louise Ave
- 17232 Kingsbury St
- 17238 Kingsbury St
- 10620 Louise Ave
- 10604 Louise Ave
- 17228 Kingsbury St
- 17217 Germain St
- 10624 Louise Ave
- 10616 Louise Ave
- 17218 Kingsbury St
- 10630 Louise Ave
- 17244 Kingsbury St
- 17246 Germain St
- 17212 Kingsbury St
- 10632 Louise Ave
- 17236 Germain St
- 10636 Louise Ave