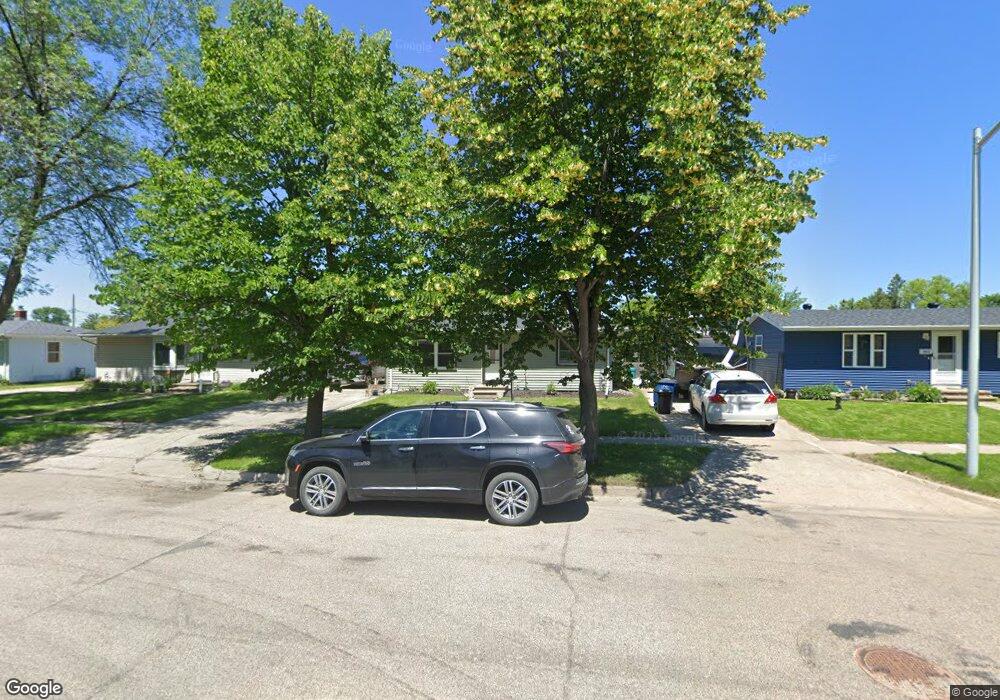
1724 10th Ave N Moorhead, MN 56560
Estimated Value: $187,000 - $211,000
3
Beds
2
Baths
990
Sq Ft
$203/Sq Ft
Est. Value
About This Home
This home is located at 1724 10th Ave N, Moorhead, MN 56560 and is currently estimated at $201,088, approximately $203 per square foot. 1724 10th Ave N is a home located in Clay County with nearby schools including R. Asp Elementary School, Horizon Middle School, and Moorhead High School.
Ownership History
Date
Name
Owned For
Owner Type
Purchase Details
Closed on
Sep 13, 2017
Sold by
Bosek Properties Llc
Bought by
Friese Patrick K and Friese Cynthia K
Current Estimated Value
Purchase Details
Closed on
Oct 28, 2011
Sold by
Bosek Keith L and Lecuyer Anastasia
Bought by
Friese Patrick K and Friese Cynthia K
Purchase Details
Closed on
Oct 4, 2011
Sold by
Dwyer Jacquelyn Marie
Bought by
Bosek Keith L and Lecuyer Anastasia
Purchase Details
Closed on
Jul 25, 2011
Sold by
Bosek Keith L and Lecuyer Anastasia
Bought by
Dwyer Jacquelyn Marie
Purchase Details
Closed on
Dec 5, 2008
Sold by
Bosek Keith L and Levuyer Anastasia
Bought by
Alonzo Gregorio and Alonzo Rosario
Create a Home Valuation Report for This Property
The Home Valuation Report is an in-depth analysis detailing your home's value as well as a comparison with similar homes in the area
Home Values in the Area
Average Home Value in this Area
Purchase History
| Date | Buyer | Sale Price | Title Company |
|---|---|---|---|
| Friese Patrick K | $117,900 | -- | |
| Friese Patrick K | -- | None Available | |
| Bosek Keith L | -- | None Available | |
| Dwyer Jacquelyn Marie | $119,900 | None Available | |
| Alonzo Gregorio | $95,000 | None Available |
Source: Public Records
Tax History Compared to Growth
Tax History
| Year | Tax Paid | Tax Assessment Tax Assessment Total Assessment is a certain percentage of the fair market value that is determined by local assessors to be the total taxable value of land and additions on the property. | Land | Improvement |
|---|---|---|---|---|
| 2025 | $2,094 | $180,500 | $31,000 | $149,500 |
| 2024 | $2,094 | $163,100 | $31,000 | $132,100 |
| 2023 | $2,122 | $159,600 | $31,000 | $128,600 |
| 2022 | $1,890 | $153,500 | $31,000 | $122,500 |
| 2021 | $1,808 | $138,500 | $28,400 | $110,100 |
| 2020 | $1,582 | $132,400 | $28,400 | $104,000 |
| 2019 | $1,468 | $121,700 | $28,400 | $93,300 |
| 2018 | $1,464 | $120,500 | $28,400 | $92,100 |
| 2017 | $1,500 | $120,500 | $28,400 | $92,100 |
| 2016 | $1,282 | $126,100 | $28,400 | $97,700 |
| 2015 | $1,160 | $104,400 | $21,800 | $82,600 |
| 2014 | $1,164 | $104,400 | $21,800 | $82,600 |
Source: Public Records
Map
Nearby Homes
- 1802 10th Ave N
- 1720 10th Ave N
- 1716 10th Ave N
- 1807 11th Ave N
- 1801 11th Ave N
- 1811 11th Ave N
- 1715 11th Ave N
- 1810 10th Ave N
- 1710 10th Ave N
- 1815 11th Ave N
- 1711 11th Ave N
- 1719 10th Ave N
- 1715 10th Ave N
- 1819 11th Ave N
- 1708 10th Ave N
- 1707 11th Ave N
- 1807 10th Ave N
- 1711 10th Ave N
- 1103 18 1 2 St N
- 1103 18 1/2 St N