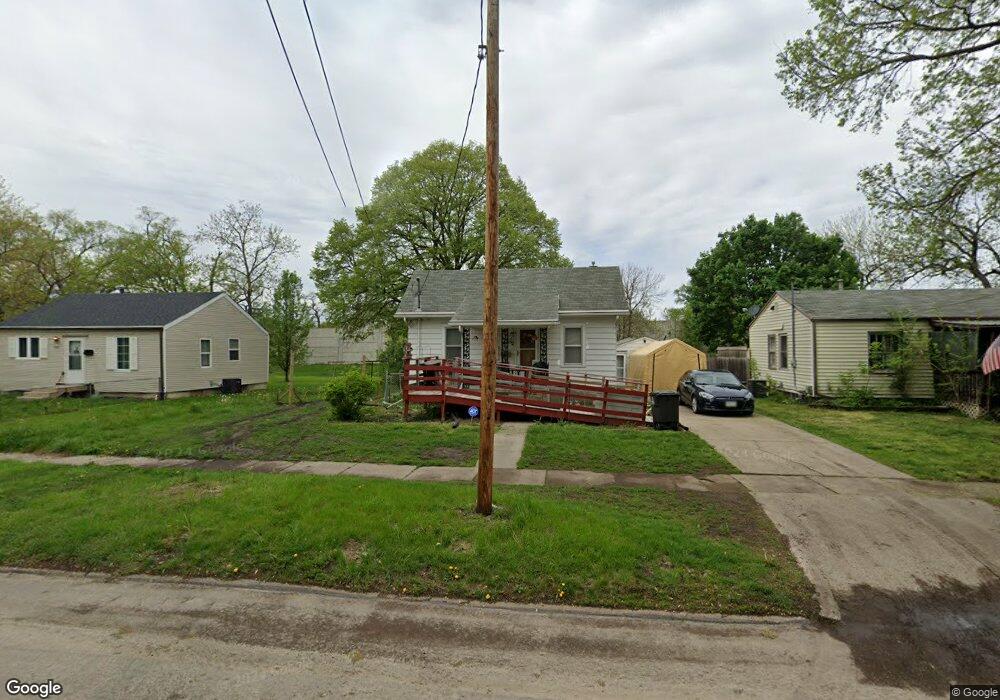
1724 E 22nd St Des Moines, IA 50317
Fairmont Park NeighborhoodEstimated Value: $103,000 - $135,000
2
Beds
1
Bath
624
Sq Ft
$199/Sq Ft
Est. Value
About This Home
This home is located at 1724 E 22nd St, Des Moines, IA 50317 and is currently estimated at $124,133, approximately $198 per square foot. 1724 E 22nd St is a home located in Polk County with nearby schools including Phillips Elementary, Goodrell Middle School, and North High School.
Ownership History
Date
Name
Owned For
Owner Type
Purchase Details
Closed on
May 26, 2015
Sold by
Ingersoll Ruth M
Bought by
Ingersoll Loretta Jean and Ingersoll Donald Anthony
Current Estimated Value
Purchase Details
Closed on
Nov 30, 2009
Sold by
Ingersoll Ruth M
Bought by
Ingersoll Ruth M and Ingersoll Donald Anthony
Purchase Details
Closed on
May 25, 2007
Sold by
Moore Nathan Robert
Bought by
Ingersoll Ruth M
Home Financials for this Owner
Home Financials are based on the most recent Mortgage that was taken out on this home.
Original Mortgage
$54,400
Outstanding Balance
$33,252
Interest Rate
6.26%
Mortgage Type
Purchase Money Mortgage
Estimated Equity
$90,881
Create a Home Valuation Report for This Property
The Home Valuation Report is an in-depth analysis detailing your home's value as well as a comparison with similar homes in the area
Home Values in the Area
Average Home Value in this Area
Purchase History
| Date | Buyer | Sale Price | Title Company |
|---|---|---|---|
| Ingersoll Loretta Jean | -- | None Available | |
| Ingersoll Ruth M | -- | None Available | |
| Ingersoll Ruth M | $57,500 | None Available |
Source: Public Records
Mortgage History
| Date | Status | Borrower | Loan Amount |
|---|---|---|---|
| Open | Ingersoll Ruth M | $54,400 |
Source: Public Records
Tax History
| Year | Tax Paid | Tax Assessment Tax Assessment Total Assessment is a certain percentage of the fair market value that is determined by local assessors to be the total taxable value of land and additions on the property. | Land | Improvement |
|---|---|---|---|---|
| 2025 | $1,636 | $114,700 | $25,400 | $89,300 |
| 2024 | $1,636 | $100,600 | $22,000 | $78,600 |
| 2023 | $1,620 | $100,600 | $22,000 | $78,600 |
| 2022 | $816 | $77,600 | $17,400 | $60,200 |
| 2021 | $750 | $77,600 | $17,400 | $60,200 |
| 2020 | $1,556 | $68,800 | $15,400 | $53,400 |
| 2019 | $708 | $68,800 | $15,400 | $53,400 |
| 2018 | $1,084 | $61,200 | $13,400 | $47,800 |
| 2017 | $824 | $61,200 | $13,400 | $47,800 |
| 2016 | $940 | $59,700 | $12,900 | $46,800 |
| 2015 | $940 | $59,700 | $12,900 | $46,800 |
| 2014 | $924 | $55,900 | $11,900 | $44,000 |
Source: Public Records
Map
Nearby Homes
- 1517 Delaware Ave
- 1901 E 23rd St
- 2113 E 21st St
- 2208 Tichenor St
- 1415 Delaware Ave
- 1529 E 19th St
- 1820 E 25th St
- 1410 E 23rd St
- 1404 E 19th St
- 1349 de Wolf St
- 1536 Stewart St
- 1321 E 25th St
- 1312 E 25th Ct
- 2503 E 24th St
- 1311 E 25th Ct
- 1273 E 18th St
- 2539 E 23rd St
- 2520 E 25th St
- 913 E 23rd St
- 2644 Chicago Ave
Your Personal Tour Guide
Ask me questions while you tour the home.