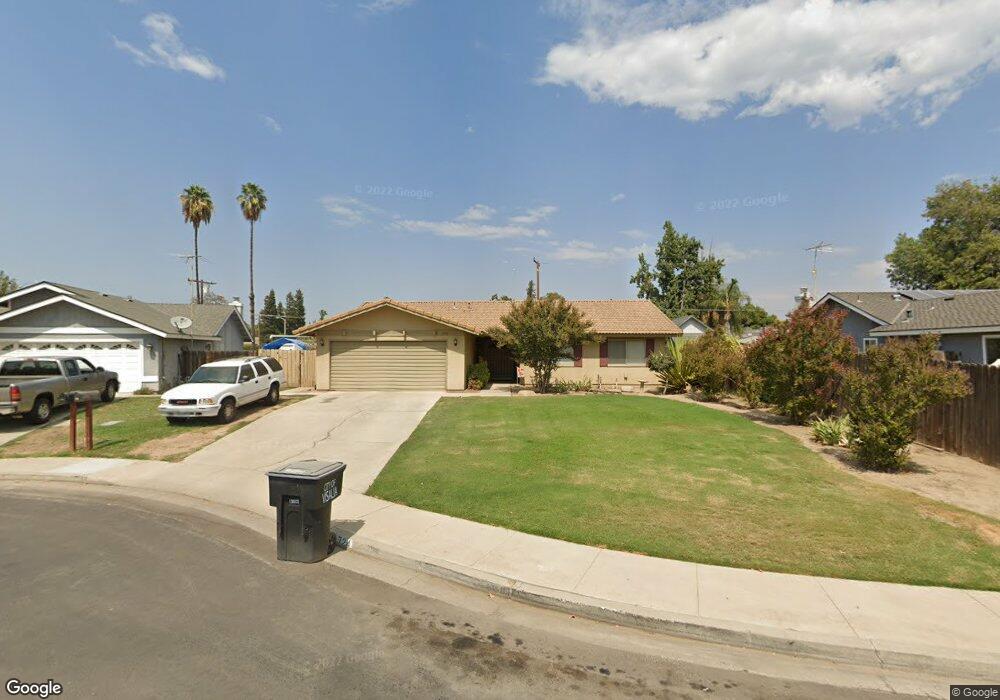
1724 E Mary Ave Visalia, CA 93292
Southeast Visalia Neighborhood
3
Beds
2
Baths
1,431
Sq Ft
10,890
Sq Ft Lot
About This Home
This home is located at 1724 E Mary Ave, Visalia, CA 93292. 1724 E Mary Ave is a home located in Tulare County with nearby schools including Annie R. Mitchell Elementary School, Divisadero Middle School, and Mt. Whitney High School.
Create a Home Valuation Report for This Property
The Home Valuation Report is an in-depth analysis detailing your home's value as well as a comparison with similar homes in the area
Home Values in the Area
Average Home Value in this Area
Tax History
| Year | Tax Paid | Tax Assessment Tax Assessment Total Assessment is a certain percentage of the fair market value that is determined by local assessors to be the total taxable value of land and additions on the property. | Land | Improvement |
|---|---|---|---|---|
| 2022 | $1,447 | $143,718 | $40,945 | $102,773 |
| 2021 | $1,427 | $140,900 | $40,142 | $100,758 |
| 2020 | $1,410 | $139,455 | $39,730 | $99,725 |
| 2019 | $1,373 | $136,721 | $38,951 | $97,770 |
| 2018 | $1,333 | $134,040 | $38,187 | $95,853 |
| 2017 | $1,322 | $131,412 | $37,438 | $93,974 |
| 2016 | $1,291 | $128,835 | $36,704 | $92,131 |
| 2015 | $1,252 | $126,900 | $36,153 | $90,747 |
| 2014 | $1,252 | $124,414 | $35,445 | $88,969 |
Source: Public Records
Map
Nearby Homes
- 2330 S Stover St
- 1827 E Evergreen Ct
- 2021 E Laura Ave
- 1735 E Country Ct
- 2046 E Laura Ave
- 1507 E Vassar Dr
- 1443 E Vassar Dr
- 1515 E Castlecrest Ave
- 1818 S Cain St
- 1818 S Cain Ct
- 1848 E Vassar Dr
- 1841 S Enos St
- 1338 E Castlecrest Ave
- 1652 S Exeter Ct
- 1828 E Hillcrest Dr
- 1828 S Hillcrest Dr
- 3004 SE La Vida Ct
- 2246 S Bradley Ct
- 2323 E Hillcrest Ave
- 3015 S Tracy St
- 1736 E Mary Ave
- 1714 E Mary Ave
- 1731 E Seeger Ct
- 1717 E Seeger Ct
- 1750 E Mary Ave
- 1741 E Seeger Ct
- 1725 E Mary Ave
- 1715 E Mary Ave
- 1801 E Seeger Ct
- 1735 E Mary Ave
- 1749 E Mary Ave
- 1811 E Seeger Ct
- 0 Seeger Ave Unit 1 75130
- 0 Seeger Ave Unit 8 75139
- 0 Seeger Ave Unit 7 75138
- 0 Seeger Ave Unit 6 75137
- 0 Seeger Ave Unit 5 75135
- 0 Seeger Ave Unit 4 75134
- 0 Seeger Ave Unit 3 75133
- 0 Seeger Ave Unit 2 75131
Your Personal Tour Guide
Ask me questions while you tour the home.