1724 Lake Shore Crest Dr Unit 11 Reston, VA 20190
Reston Town Center NeighborhoodEstimated Value: $314,000 - $411,000
1
Bed
1
Bath
801
Sq Ft
$438/Sq Ft
Est. Value
About This Home
This home is located at 1724 Lake Shore Crest Dr Unit 11, Reston, VA 20190 and is currently estimated at $350,816, approximately $437 per square foot. 1724 Lake Shore Crest Dr Unit 11 is a home located in Fairfax County with nearby schools including Lake Anne Elementary, Langston Hughes Middle School, and South Lakes High School.
Ownership History
Date
Name
Owned For
Owner Type
Purchase Details
Closed on
Jan 2, 2019
Sold by
Larsen Elnita P and Larsen Kimberley Diane
Bought by
Larsen Elnita P and Larsen Kimberley Diane
Current Estimated Value
Home Financials for this Owner
Home Financials are based on the most recent Mortgage that was taken out on this home.
Original Mortgage
$214,400
Interest Rate
4.6%
Mortgage Type
New Conventional
Purchase Details
Closed on
Nov 5, 2018
Sold by
Klein Myrna F
Bought by
Larsen Elnita P and Larsen Kimberley Diane
Home Financials for this Owner
Home Financials are based on the most recent Mortgage that was taken out on this home.
Original Mortgage
$214,400
Interest Rate
4.6%
Mortgage Type
New Conventional
Purchase Details
Closed on
Jul 29, 1994
Sold by
Edgewater Lp
Bought by
Hulser Frances A
Home Financials for this Owner
Home Financials are based on the most recent Mortgage that was taken out on this home.
Original Mortgage
$89,150
Interest Rate
8.25%
Create a Home Valuation Report for This Property
The Home Valuation Report is an in-depth analysis detailing your home's value as well as a comparison with similar homes in the area
Home Values in the Area
Average Home Value in this Area
Purchase History
| Date | Buyer | Sale Price | Title Company |
|---|---|---|---|
| Larsen Elnita P | -- | None Available | |
| Larsen Elnita P | $268,000 | First American Title Ins Co | |
| Hulser Frances A | $91,900 | -- |
Source: Public Records
Mortgage History
| Date | Status | Borrower | Loan Amount |
|---|---|---|---|
| Open | Renshaw Rebekah | $314,682 | |
| Previous Owner | Larsen Elnita P | $214,400 | |
| Previous Owner | Klein Myrna F | $125,000 | |
| Previous Owner | Hulser Frances A | $89,150 |
Source: Public Records
Tax History Compared to Growth
Tax History
| Year | Tax Paid | Tax Assessment Tax Assessment Total Assessment is a certain percentage of the fair market value that is determined by local assessors to be the total taxable value of land and additions on the property. | Land | Improvement |
|---|---|---|---|---|
| 2024 | $3,591 | $292,760 | $59,000 | $233,760 |
| 2023 | $3,100 | $259,080 | $52,000 | $207,080 |
| 2022 | $3,270 | $269,880 | $54,000 | $215,880 |
| 2021 | $3,285 | $264,590 | $53,000 | $211,590 |
| 2020 | $3,215 | $256,880 | $51,000 | $205,880 |
| 2019 | $2,813 | $256,880 | $51,000 | $205,880 |
| 2018 | $3,014 | $262,120 | $52,000 | $210,120 |
| 2017 | $2,782 | $230,320 | $46,000 | $184,320 |
| 2016 | $2,545 | $211,100 | $42,000 | $169,100 |
| 2015 | $2,696 | $231,820 | $46,000 | $185,820 |
| 2014 | $2,690 | $231,820 | $46,000 | $185,820 |
Source: Public Records
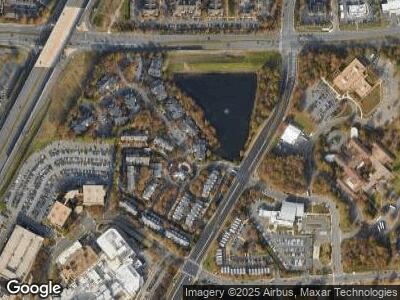
Map
Nearby Homes
- 1720 Lake Shore Crest Dr Unit 35
- 1716 Lake Shore Crest Dr Unit 16
- 1705 Lake Shore Crest Dr Unit 25
- 1701 Lake Shore Crest Dr Unit 11
- 1704 Lake Shore Crest Dr Unit 32
- 12012 Taliesin Place Unit 26
- 12025 New Dominion Pkwy Unit 509
- 1830 Fountain Dr Unit 806
- 11990 Market St Unit 805
- 11990 Market St Unit 413
- 11990 Market St Unit 1404
- 11990 Market St Unit 1205
- 11990 Market St Unit 1311
- 12127 Chancery Station Cir
- 12170 Abington Hall Place Unit 204
- 12000 Market St Unit 149
- 12000 Market St Unit 318
- 12000 Market St Unit 131
- 12000 Market St Unit 189
- 12000 Market St Unit 343
- 1724 Lake Shore Crest Dr Unit 33
- 1724 Lake Shore Crest Dr Unit 25
- 1724 Lake Shore Crest Dr Unit 13
- 1724 Lake Shore Crest Dr Unit 22
- 1724 Lake Shore Crest Dr Unit 12
- 1724 Lake Shore Crest Dr Unit 16
- 1724 Lake Shore Crest Dr Unit 11
- 1724 Lake Shore Crest Dr Unit 21
- 1724 Lake Shore Crest Dr Unit 34
- 1724 Lake Shore Crest Dr Unit 24
- 1724 Lake Shore Crest Dr Unit 23
- 1724 Lake Shore Crest Dr Unit 33
- 1724 Lake Shore Crest Dr Unit 3
- 1724 Lake Shore Crest Dr Unit 4
- 1724 Lake Shore Crest Dr Unit 36
- 1724 Lake Shore Crest Dr Unit 22
- 1724 Lake Shore Crest Dr Unit 15
- 1724 Lake Shore Crest Dr Unit 13
- 1724 Lake Shore Crest Dr Unit 11
- 1724 Lake Shore Crest Dr Unit 12