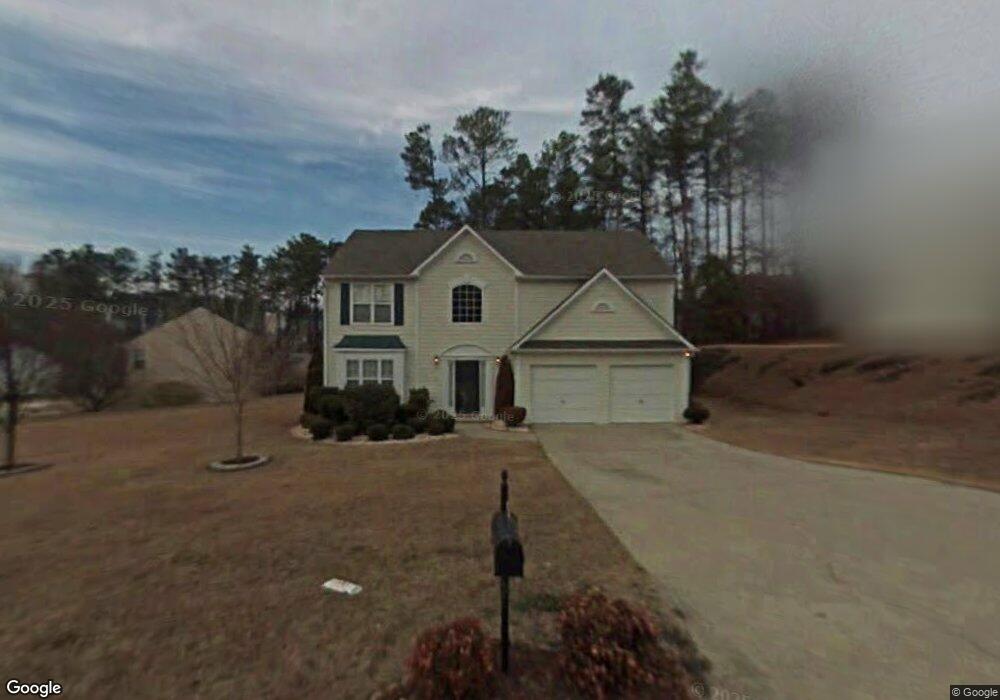
1724 Silverchase Dr SW Unit 3 Marietta, GA 30008
Estimated Value: $392,191 - $412,000
4
Beds
3
Baths
2,039
Sq Ft
$199/Sq Ft
Est. Value
About This Home
This home is located at 1724 Silverchase Dr SW Unit 3, Marietta, GA 30008 and is currently estimated at $404,798, approximately $198 per square foot. 1724 Silverchase Dr SW Unit 3 is a home located in Cobb County with nearby schools including Birney Elementary School, Smitha Middle School, and Osborne High School.
Ownership History
Date
Name
Owned For
Owner Type
Purchase Details
Closed on
Oct 1, 2007
Sold by
Miller John C and Miller Kimberly D
Bought by
Holmes Merica L
Current Estimated Value
Home Financials for this Owner
Home Financials are based on the most recent Mortgage that was taken out on this home.
Original Mortgage
$193,500
Outstanding Balance
$122,567
Interest Rate
6.49%
Mortgage Type
New Conventional
Estimated Equity
$282,231
Purchase Details
Closed on
Nov 29, 2000
Sold by
Fagaley Glenn E and Fagaley Michelle
Bought by
Miller John C and Miller Kimberly D
Home Financials for this Owner
Home Financials are based on the most recent Mortgage that was taken out on this home.
Original Mortgage
$161,050
Interest Rate
7.82%
Mortgage Type
VA
Purchase Details
Closed on
Oct 31, 1996
Sold by
S G Torrey Atlanta Ltd
Bought by
Fagaley Glenn E and Hahn Donna M Hugh J
Create a Home Valuation Report for This Property
The Home Valuation Report is an in-depth analysis detailing your home's value as well as a comparison with similar homes in the area
Home Values in the Area
Average Home Value in this Area
Purchase History
| Date | Buyer | Sale Price | Title Company |
|---|---|---|---|
| Holmes Merica L | $193,500 | -- | |
| Miller John C | $157,900 | -- | |
| Fagaley Glenn E | $122,800 | -- |
Source: Public Records
Mortgage History
| Date | Status | Borrower | Loan Amount |
|---|---|---|---|
| Open | Holmes Merica L | $193,500 | |
| Previous Owner | Miller John C | $161,050 | |
| Closed | Fagaley Glenn E | $0 |
Source: Public Records
Tax History Compared to Growth
Tax History
| Year | Tax Paid | Tax Assessment Tax Assessment Total Assessment is a certain percentage of the fair market value that is determined by local assessors to be the total taxable value of land and additions on the property. | Land | Improvement |
|---|---|---|---|---|
| 2024 | $3,841 | $163,760 | $36,000 | $127,760 |
| 2023 | $2,600 | $131,592 | $18,000 | $113,592 |
| 2022 | $2,290 | $91,524 | $18,000 | $73,524 |
| 2021 | $2,290 | $91,524 | $18,000 | $73,524 |
| 2020 | $2,132 | $84,320 | $18,000 | $66,320 |
| 2019 | $2,132 | $84,320 | $18,000 | $66,320 |
| 2018 | $1,644 | $63,192 | $18,000 | $45,192 |
| 2017 | $1,560 | $63,192 | $18,000 | $45,192 |
| 2016 | $1,566 | $63,356 | $20,000 | $43,356 |
| 2015 | $1,424 | $57,176 | $20,000 | $37,176 |
| 2014 | $1,436 | $57,176 | $0 | $0 |
Source: Public Records
Map
Nearby Homes
- 1719 Silverchase Dr SW
- 1613 Sparrow Wood Ln SW Unit 3
- 1829 Wellborn Way SW
- 1559 Woodmore Dr SW
- 1703 Silverchase Dr SW
- 1911 Pair Rd SW
- 1575 Milford Creek Ln SW
- 3156 Sasanqua Ln SW
- 1790 N Milford Creek Ln SW
- 2960 Milford Trail SW
- 3145 Fern Valley Dr SW
- 3159 Fern Valley Dr SW
- 3123 Milford Chase SW
- 3290 Hidden Valley Way SW
- 1799 Milford Creek Ct SW
- 1769 Milford Creek Courts SW
- 2099 Redbud Ct SW
- 1722 Silverchase Dr SW Unit 3
- 3161 Silverchase Cir SW
- 1723 Silverchase Dr SW
- 1720 Silverchase Dr SW
- 3159 Silverchase Cir SW
- 1721 Silverchase Dr SW
- 1579 Woodmore Dr SW
- 0 Silverchase Dr SW Unit 8075779
- 0 Silverchase Dr SW Unit 8956059
- 0 Silverchase Dr SW Unit 8981880
- 0 Silverchase Dr SW Unit 8946081
- 0 Silverchase Dr SW Unit 7022333
- 0 Silverchase Dr SW Unit 7045847
- 0 Silverchase Dr SW Unit 7058755
- 0 Silverchase Dr SW Unit 7060625
- 0 Silverchase Dr SW Unit 7409467
- 0 Silverchase Dr SW Unit 7417137
- 0 Silverchase Cir SW Unit 8484875
- 0 Silverchase Cir SW Unit 7409487
- 1581 Woodmore Dr SW Unit 6