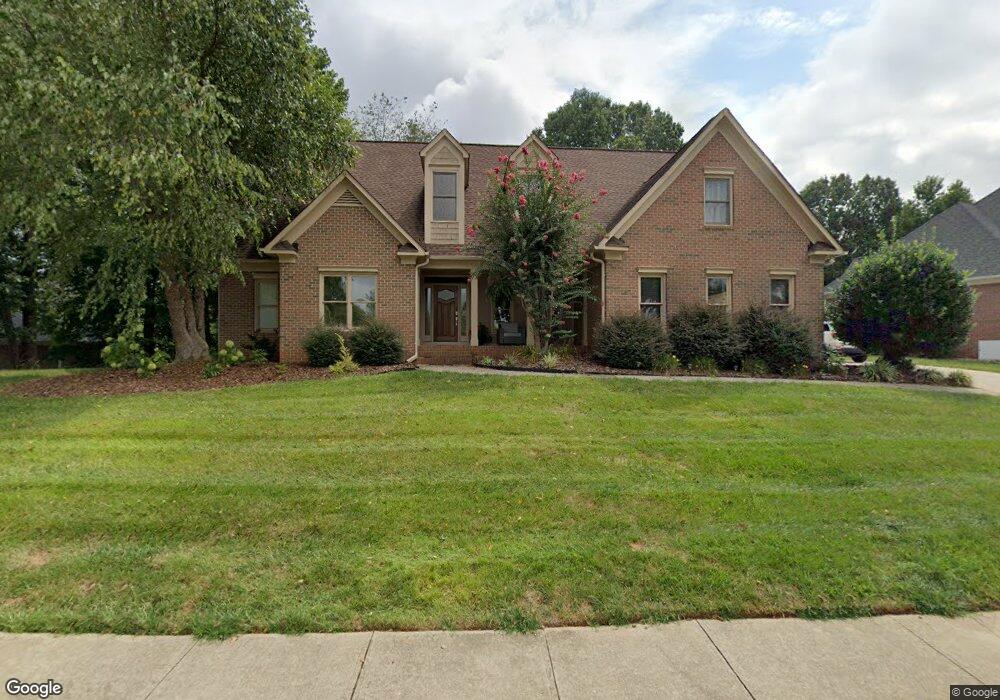
1724 Withers Dr Denver, NC 28037
Estimated Value: $672,362 - $800,000
4
Beds
3
Baths
2,895
Sq Ft
$254/Sq Ft
Est. Value
About This Home
This home is located at 1724 Withers Dr, Denver, NC 28037 and is currently estimated at $735,091, approximately $253 per square foot. 1724 Withers Dr is a home located in Lincoln County with nearby schools including St. James Elementary School, East Lincoln Middle School, and East Lincoln High School.
Ownership History
Date
Name
Owned For
Owner Type
Purchase Details
Closed on
Sep 24, 2020
Sold by
Holsinger Ronald Brian and Holsinger Tammy
Bought by
Farrington Matthew Ryan and Farrington Brittany
Current Estimated Value
Home Financials for this Owner
Home Financials are based on the most recent Mortgage that was taken out on this home.
Original Mortgage
$382,500
Outstanding Balance
$340,213
Interest Rate
2.9%
Mortgage Type
New Conventional
Estimated Equity
$394,878
Purchase Details
Closed on
Sep 22, 2003
Bought by
Holsinger Ronald Brian and Holsinger Tammy
Purchase Details
Closed on
Aug 7, 2002
Bought by
Wells Fargo Home Mortgage Inc
Purchase Details
Closed on
Jan 30, 2002
Bought by
Brooks Raymond N and Brooks Tammy
Purchase Details
Closed on
Mar 29, 1999
Bought by
Marquee Builders Llc
Create a Home Valuation Report for This Property
The Home Valuation Report is an in-depth analysis detailing your home's value as well as a comparison with similar homes in the area
Purchase History
| Date | Buyer | Sale Price | Title Company |
|---|---|---|---|
| Farrington Matthew Ryan | $425,000 | None Available | |
| Holsinger Ronald Brian | $266,000 | -- | |
| Wells Fargo Home Mortgage Inc | $265,500 | -- | |
| Brooks Raymond N | $330,000 | -- | |
| Marquee Builders Llc | $105,000 | -- | |
| Custom Development Properties Llc | $255,000 | -- |
Source: Public Records
Mortgage History
| Date | Status | Borrower | Loan Amount |
|---|---|---|---|
| Open | Farrington Matthew Ryan | $382,500 |
Source: Public Records
Tax History
| Year | Tax Paid | Tax Assessment Tax Assessment Total Assessment is a certain percentage of the fair market value that is determined by local assessors to be the total taxable value of land and additions on the property. | Land | Improvement |
|---|---|---|---|---|
| 2025 | $3,775 | $600,759 | $74,000 | $526,759 |
| 2024 | $3,743 | $600,759 | $74,000 | $526,759 |
| 2023 | $3,738 | $600,759 | $74,000 | $526,759 |
| 2022 | $3,100 | $402,879 | $70,000 | $332,879 |
| 2021 | $3,072 | $402,879 | $70,000 | $332,879 |
| 2020 | $2,877 | $402,879 | $70,000 | $332,879 |
| 2019 | $2,877 | $402,879 | $70,000 | $332,879 |
| 2018 | $2,503 | $330,788 | $68,500 | $262,288 |
| 2017 | $2,402 | $330,788 | $68,500 | $262,288 |
| 2016 | $2,393 | $330,788 | $68,500 | $262,288 |
| 2015 | $2,537 | $330,788 | $68,500 | $262,288 |
| 2014 | $2,436 | $323,318 | $70,000 | $253,318 |
Source: Public Records
Map
Nearby Homes
- 1775 Mount Carmel Cir
- 1546 Valhalla Dr
- 1543 Withers Dr
- 1470 Valhalla Dr
- 7245 Willow Brook Ct
- 1063 Ventosa Dr
- 1486 Winged Foot Dr
- 1064 Ventosa Dr
- 1515 Baltusrol Dr
- 7246 Windy Ridge Dr
- 2A Ventosa Dr
- Lot 36 Misty Creek Dr Unit 36
- 1365 Winged Foot Dr
- Lot 6 Jerry Ross Ln
- 1376 Winged Foot Dr
- 2118 Killian Creek Dr
- 1037 Ventosa Dr
- 5098 Turtle Creek Dr
- 5293 Turtle Creek Dr
- 1140 Oakbrook Ln Unit 54
- 1740 Withers Dr
- 1712 Withers Dr
- 1750 Withers Dr
- 7215 Berkshire Ct
- 1793 Mount Carmel Cir
- 1793 Mount Carmel Cir Unit 52/53
- 7213 Berkshire Ct
- 1739 Withers Dr
- 1729 Withers Dr
- 1760 Withers Dr
- 1805 Mount Carmel Cir
- 1783 Mount Carmel Cir
- 1749 Withers Dr
- 1723 Withers Dr
- 1715 Withers Dr
- 1705 Withers Dr
- 1759 Withers Dr
- 1809 Mount Carmel Cir
- 1770 Withers Dr
- 339 Withers Dr
Your Personal Tour Guide
Ask me questions while you tour the home.