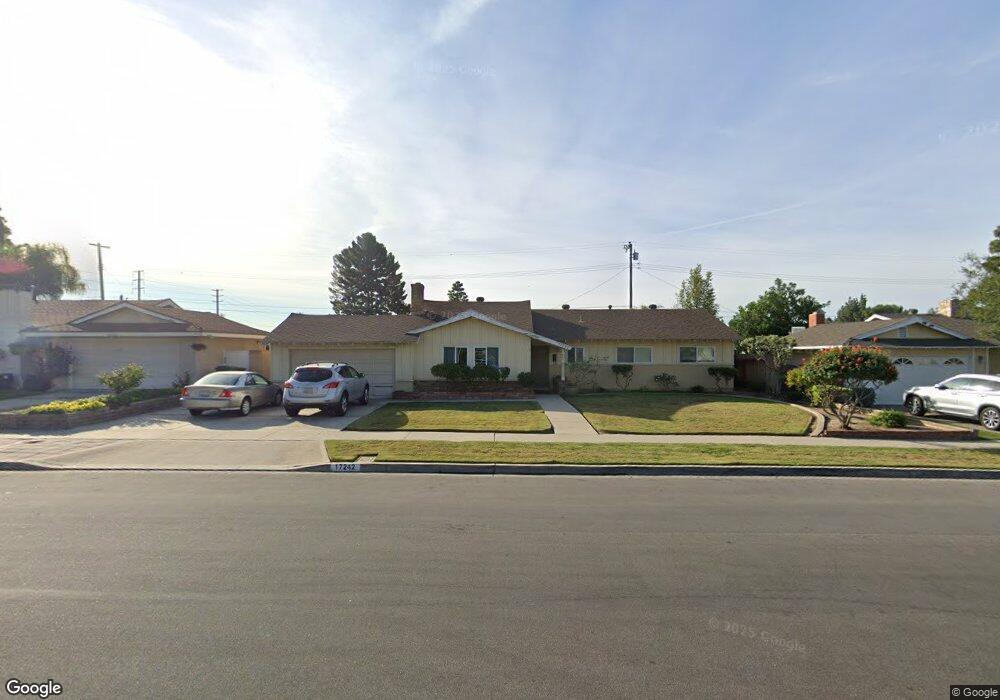
17242 La Collette Place Yorba Linda, CA 92886
Estimated Value: $1,164,000 - $1,307,000
3
Beds
2
Baths
1,644
Sq Ft
$733/Sq Ft
Est. Value
About This Home
This home is located at 17242 La Collette Place, Yorba Linda, CA 92886 and is currently estimated at $1,205,084, approximately $733 per square foot. 17242 La Collette Place is a home located in Orange County with nearby schools including Van Buren Elementary School, Kraemer Middle School, and Valencia High School.
Ownership History
Date
Name
Owned For
Owner Type
Purchase Details
Closed on
Mar 21, 2016
Sold by
Henderson Clarence E and Henderson Barbara J
Bought by
Henderson Barbara J
Current Estimated Value
Home Financials for this Owner
Home Financials are based on the most recent Mortgage that was taken out on this home.
Original Mortgage
$274,000
Outstanding Balance
$217,445
Interest Rate
3.73%
Mortgage Type
New Conventional
Estimated Equity
$987,639
Purchase Details
Closed on
Aug 25, 2005
Sold by
Rangel Karen M and Oliveira Lynda A
Bought by
Henderson Clarence E and Henderson Barbara J
Home Financials for this Owner
Home Financials are based on the most recent Mortgage that was taken out on this home.
Original Mortgage
$300,000
Interest Rate
5.72%
Mortgage Type
Fannie Mae Freddie Mac
Purchase Details
Closed on
Mar 10, 1993
Sold by
Perardi Albert S
Bought by
Perardi Albert S and Albert S Perardi Trust
Create a Home Valuation Report for This Property
The Home Valuation Report is an in-depth analysis detailing your home's value as well as a comparison with similar homes in the area
Home Values in the Area
Average Home Value in this Area
Purchase History
| Date | Buyer | Sale Price | Title Company |
|---|---|---|---|
| Henderson Barbara J | -- | Bnt Title Company Of Ca | |
| Henderson Clarence E | $650,000 | Ticor Title | |
| Perardi Albert S | -- | -- |
Source: Public Records
Mortgage History
| Date | Status | Borrower | Loan Amount |
|---|---|---|---|
| Open | Henderson Barbara J | $274,000 | |
| Previous Owner | Henderson Clarence E | $300,000 |
Source: Public Records
Tax History Compared to Growth
Tax History
| Year | Tax Paid | Tax Assessment Tax Assessment Total Assessment is a certain percentage of the fair market value that is determined by local assessors to be the total taxable value of land and additions on the property. | Land | Improvement |
|---|---|---|---|---|
| 2025 | $9,785 | $888,271 | $762,529 | $125,742 |
| 2024 | $9,785 | $870,854 | $747,577 | $123,277 |
| 2023 | $8,800 | $777,178 | $677,575 | $99,603 |
| 2022 | $8,718 | $761,940 | $664,290 | $97,650 |
| 2021 | $8,562 | $747,000 | $651,264 | $95,736 |
| 2020 | $7,797 | $678,300 | $582,564 | $95,736 |
| 2019 | $7,525 | $665,000 | $571,141 | $93,859 |
| 2018 | $7,572 | $665,000 | $571,141 | $93,859 |
| 2017 | $7,590 | $665,000 | $571,141 | $93,859 |
| 2016 | $7,089 | $620,000 | $526,141 | $93,859 |
| 2015 | $7,104 | $620,000 | $526,141 | $93,859 |
| 2014 | $6,031 | $528,000 | $434,141 | $93,859 |
Source: Public Records
Map
Nearby Homes
- 5130 Webb Place
- 17001 La Kenice Way
- 1261 Desoto St
- 1429 Prospect Ave Unit B
- 5141 Siesta Ln
- 4781 Kona Kove Way
- 4802 Brookway Ave
- 17781 Lerene Dr
- 5231 Highland Ave
- 4942 Gem Ln
- 5661 Casa Loma Ave
- 1524 Larsen Ln
- 17841 Buena Vista Ave
- 17842 Caballo Dr
- 1527 Evans Ln
- 4891 Eureka Ave Unit 25
- 732 Olivier Dr
- 726 Olivier Dr
- 727 Olivier Dr
- 718 Olivier Dr
- 17262 La Collette Place
- 17232 La Collette Place
- 17282 La Collette Place
- 17222 La Collette Place
- 5152 Casa Oro Dr
- 5151 Casa Oro Dr
- 17281 La Collette Place
- 17202 La Collette Place
- 5132 Casa Oro Dr
- 5131 Casa Oro Dr
- 5131 Van Buren St
- 5152 Briarhill Dr
- 17312 La Collette Place
- 17311 Calgary Ave
- 17192 La Collette Place
- 5112 Casa Oro Dr
- 5132 Briarhill Dr
- 5111 Casa Oro Dr
- 17311 La Collette Place
- 5111 Van Buren St