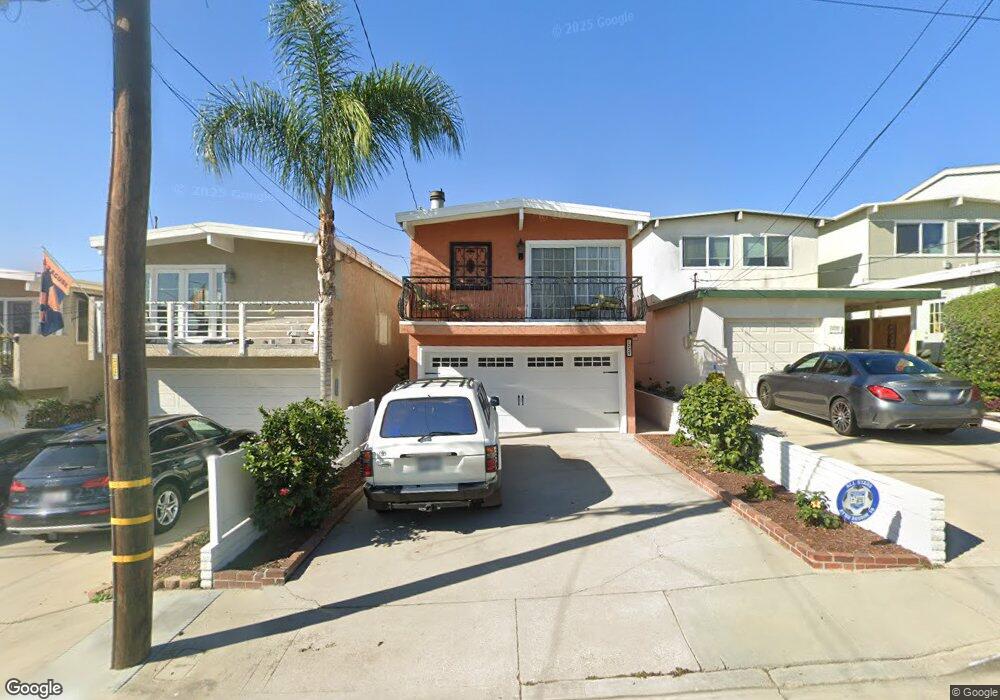
1725 Carver St Redondo Beach, CA 90278
North Redondo Beach NeighborhoodEstimated Value: $1,590,875 - $1,697,000
3
Beds
2
Baths
1,748
Sq Ft
$938/Sq Ft
Est. Value
About This Home
This home is located at 1725 Carver St, Redondo Beach, CA 90278 and is currently estimated at $1,639,969, approximately $938 per square foot. 1725 Carver St is a home located in Los Angeles County with nearby schools including Birney Elementary School, Adams Middle School, and Redondo Union High School.
Ownership History
Date
Name
Owned For
Owner Type
Purchase Details
Closed on
Aug 5, 2002
Sold by
Topalian Sahag S
Bought by
Calder Angus I and Calder Kimberly D
Current Estimated Value
Home Financials for this Owner
Home Financials are based on the most recent Mortgage that was taken out on this home.
Original Mortgage
$384,000
Outstanding Balance
$154,566
Interest Rate
5.87%
Mortgage Type
Purchase Money Mortgage
Estimated Equity
$1,485,403
Purchase Details
Closed on
Apr 4, 2000
Sold by
Mathis Glen L
Bought by
Topalian Sahag S and Topalian Wendy
Home Financials for this Owner
Home Financials are based on the most recent Mortgage that was taken out on this home.
Original Mortgage
$293,760
Interest Rate
7.62%
Purchase Details
Closed on
Jan 29, 1998
Sold by
Hein Christopher L
Bought by
Mathis Glenn L and Mathis Wendy G
Home Financials for this Owner
Home Financials are based on the most recent Mortgage that was taken out on this home.
Original Mortgage
$272,650
Interest Rate
6.9%
Create a Home Valuation Report for This Property
The Home Valuation Report is an in-depth analysis detailing your home's value as well as a comparison with similar homes in the area
Home Values in the Area
Average Home Value in this Area
Purchase History
| Date | Buyer | Sale Price | Title Company |
|---|---|---|---|
| Calder Angus I | $480,000 | Equity Title Company | |
| Topalian Sahag S | $367,500 | Old Republic Title Company | |
| Mathis Glenn L | $287,000 | Southland Title Corporation |
Source: Public Records
Mortgage History
| Date | Status | Borrower | Loan Amount |
|---|---|---|---|
| Open | Calder Angus I | $384,000 | |
| Previous Owner | Topalian Sahag S | $293,760 | |
| Previous Owner | Mathis Glenn L | $272,650 | |
| Closed | Topalian Sahag S | $36,720 |
Source: Public Records
Tax History Compared to Growth
Tax History
| Year | Tax Paid | Tax Assessment Tax Assessment Total Assessment is a certain percentage of the fair market value that is determined by local assessors to be the total taxable value of land and additions on the property. | Land | Improvement |
|---|---|---|---|---|
| 2025 | $8,354 | $695,181 | $556,153 | $139,028 |
| 2024 | $8,354 | $681,551 | $545,249 | $136,302 |
| 2023 | $8,204 | $668,188 | $534,558 | $133,630 |
| 2022 | $8,051 | $655,087 | $524,077 | $131,010 |
| 2021 | $7,831 | $642,243 | $513,801 | $128,442 |
| 2019 | $7,636 | $623,195 | $498,562 | $124,633 |
| 2018 | $7,431 | $610,977 | $488,787 | $122,190 |
| 2016 | $7,184 | $587,254 | $469,807 | $117,447 |
| 2015 | $7,055 | $578,434 | $462,751 | $115,683 |
| 2014 | $6,953 | $567,104 | $453,687 | $113,417 |
Source: Public Records
Map
Nearby Homes
- 1752 Dixon St
- 1544 Mathews Ave
- 1758 Reed St
- 1742 Reed St
- 1717 Axenty Way
- 1536 Wollacott St
- 1513 Carver St
- 1756 Ruhland Ave
- 1620 Harper Ave
- 1900 Vanderbilt Ln
- 1832 Rockefeller Ln Unit 9
- 1223 19th St
- 1612 Gates Ave
- 2025 Prospect Ave
- 1303 Harkness Ln
- 207 S Aviation Blvd
- 2001 Artesia Blvd Unit 301
- 2001 Artesia Blvd Unit 207
- 1504 Prospect Ave
- 2002 Carnegie Ln Unit A