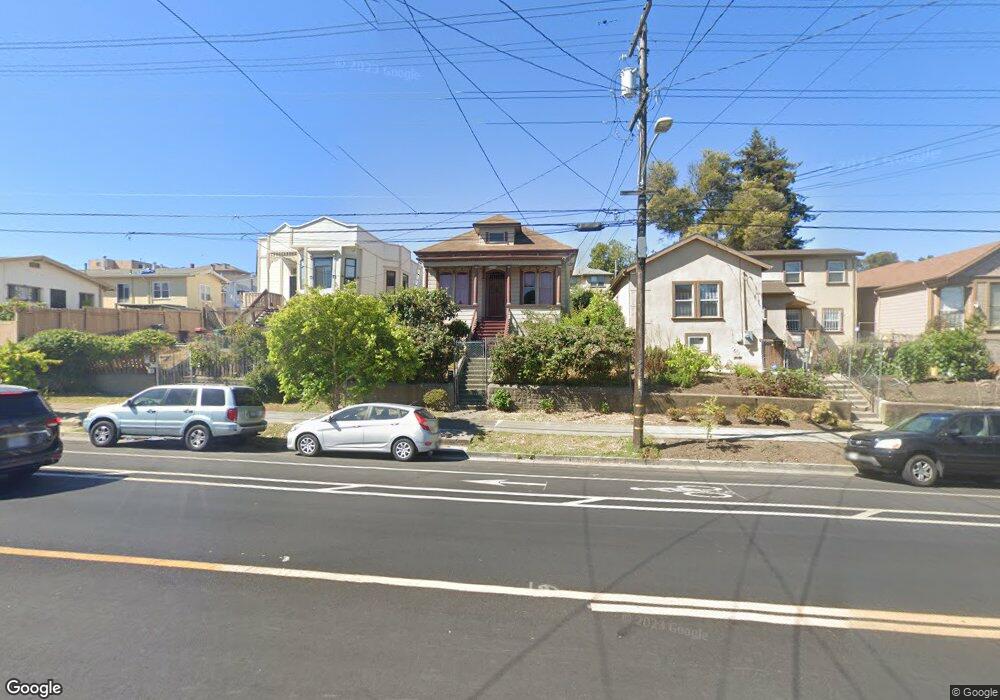
1725 E 21st St Oakland, CA 94606
San Antonio NeighborhoodEstimated Value: $524,293 - $620,000
4
Beds
1
Bath
1,352
Sq Ft
$417/Sq Ft
Est. Value
About This Home
This home is located at 1725 E 21st St, Oakland, CA 94606 and is currently estimated at $563,823, approximately $417 per square foot. 1725 E 21st St is a home located in Alameda County with nearby schools including Garfield Elementary School, Roosevelt Middle School, and Oakland High School.
Ownership History
Date
Name
Owned For
Owner Type
Purchase Details
Closed on
Nov 27, 2001
Sold by
Dang Tammy
Bought by
Dang Tammy Ngoc and The Tammy Ngoc Dang Revocable
Current Estimated Value
Purchase Details
Closed on
Jun 24, 1998
Sold by
Chinh Lai A
Bought by
Dang Tammy
Purchase Details
Closed on
Jun 28, 1996
Sold by
Tu Anna and Wong Anna Tu
Bought by
Wong Anna Tu and Dang Tammy
Create a Home Valuation Report for This Property
The Home Valuation Report is an in-depth analysis detailing your home's value as well as a comparison with similar homes in the area
Home Values in the Area
Average Home Value in this Area
Purchase History
| Date | Buyer | Sale Price | Title Company |
|---|---|---|---|
| Dang Tammy Ngoc | -- | -- | |
| Dang Tammy | -- | -- | |
| Dang Tammy | -- | -- | |
| Wong Anna Tu | -- | -- |
Source: Public Records
Tax History
| Year | Tax Paid | Tax Assessment Tax Assessment Total Assessment is a certain percentage of the fair market value that is determined by local assessors to be the total taxable value of land and additions on the property. | Land | Improvement |
|---|---|---|---|---|
| 2025 | $4,123 | $184,248 | $58,001 | $133,247 |
| 2024 | $4,123 | $180,499 | $56,864 | $130,635 |
| 2023 | $4,224 | $183,824 | $55,750 | $128,074 |
| 2022 | $4,053 | $173,220 | $54,657 | $125,563 |
| 2021 | $3,748 | $169,687 | $53,585 | $123,102 |
| 2020 | $3,704 | $174,875 | $53,036 | $121,839 |
| 2019 | $3,484 | $171,447 | $51,996 | $119,451 |
| 2018 | $3,413 | $168,086 | $50,977 | $117,109 |
| 2017 | $3,252 | $164,790 | $49,977 | $114,813 |
| 2016 | $3,068 | $161,559 | $48,997 | $112,562 |
| 2015 | $3,047 | $159,134 | $48,262 | $110,872 |
| 2014 | $2,988 | $156,016 | $47,316 | $108,700 |
Source: Public Records
Map
Nearby Homes
Your Personal Tour Guide
Ask me questions while you tour the home.