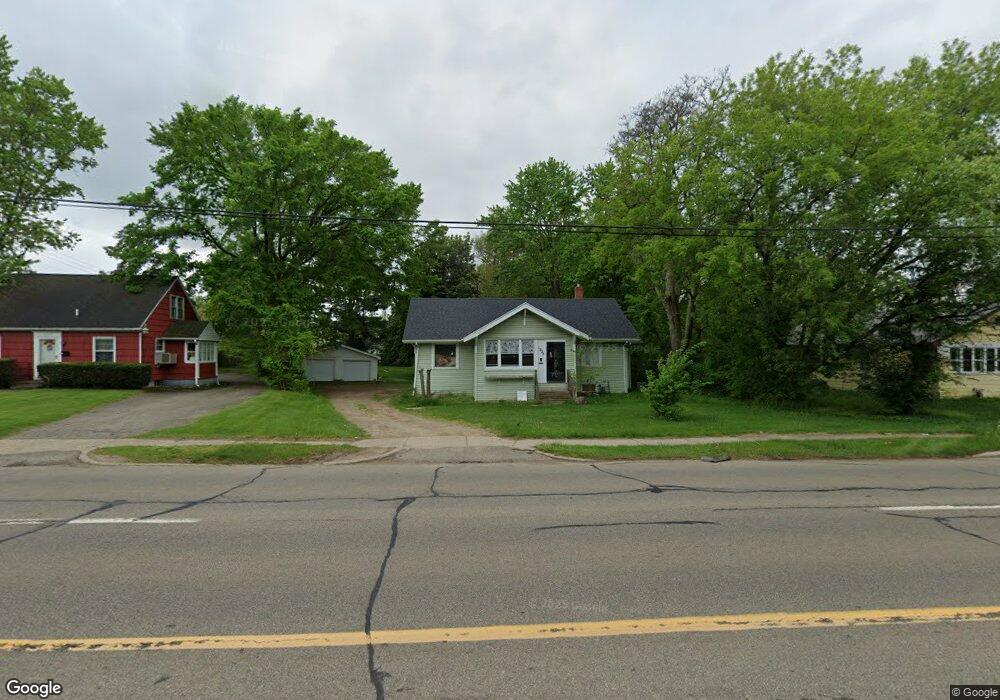
1725 Michigan Ave W Battle Creek, MI 49037
Urbandale NeighborhoodEstimated Value: $144,000 - $220,772
3
Beds
2
Baths
2,147
Sq Ft
$81/Sq Ft
Est. Value
About This Home
This home is located at 1725 Michigan Ave W, Battle Creek, MI 49037 and is currently estimated at $173,943, approximately $81 per square foot. 1725 Michigan Ave W is a home located in Calhoun County with nearby schools including LaMora Park School, Northwestern Middle School, and Battle Creek Central High School.
Ownership History
Date
Name
Owned For
Owner Type
Purchase Details
Closed on
Jan 5, 2024
Sold by
Bannester Alex Stephen
Bought by
Wilkey Brandi
Current Estimated Value
Purchase Details
Closed on
Mar 27, 2015
Sold by
Livingston James David and Livingston Vivian
Bought by
Livingston Christopher
Purchase Details
Closed on
Jun 10, 2013
Sold by
Bannester David Allen
Bought by
Bannester Alex Stephen
Purchase Details
Closed on
Dec 3, 2009
Sold by
Vanatta Kenneth L and Golden Lori A
Bought by
U S Bank National Association
Purchase Details
Closed on
Jan 27, 2003
Sold by
Jones Taylor and Jones Marie
Bought by
Vanatta Kenneth L and Golden Lori A
Home Financials for this Owner
Home Financials are based on the most recent Mortgage that was taken out on this home.
Original Mortgage
$66,000
Interest Rate
7.65%
Mortgage Type
Fannie Mae Freddie Mac
Create a Home Valuation Report for This Property
The Home Valuation Report is an in-depth analysis detailing your home's value as well as a comparison with similar homes in the area
Home Values in the Area
Average Home Value in this Area
Purchase History
| Date | Buyer | Sale Price | Title Company |
|---|---|---|---|
| Wilkey Brandi | $36,000 | None Listed On Document | |
| Wilkey Brandi | $36,000 | None Listed On Document | |
| Livingston Christopher | -- | None Available | |
| Bannester Alex Stephen | -- | None Available | |
| U S Bank National Association | $29,245 | None Available | |
| Vanatta Kenneth L | $68,000 | Multiple | |
| Vanatta Kenneth | -- | -- |
Source: Public Records
Mortgage History
| Date | Status | Borrower | Loan Amount |
|---|---|---|---|
| Previous Owner | Vanatta Kenneth | $66,000 |
Source: Public Records
Tax History Compared to Growth
Tax History
| Year | Tax Paid | Tax Assessment Tax Assessment Total Assessment is a certain percentage of the fair market value that is determined by local assessors to be the total taxable value of land and additions on the property. | Land | Improvement |
|---|---|---|---|---|
| 2025 | -- | $67,600 | $0 | $0 |
| 2024 | $1,253 | $62,032 | $0 | $0 |
| 2023 | $1,976 | $50,185 | $0 | $0 |
| 2022 | $1,403 | $44,908 | $0 | $0 |
| 2021 | $1,877 | $41,953 | $0 | $0 |
| 2020 | $1,856 | $41,777 | $0 | $0 |
| 2019 | $1,758 | $40,661 | $0 | $0 |
| 2018 | $1,758 | $33,330 | $1,942 | $31,388 |
| 2017 | $1,712 | $28,141 | $0 | $0 |
| 2016 | $1,707 | $27,432 | $0 | $0 |
| 2015 | $1,673 | $26,821 | $7,860 | $18,961 |
| 2014 | $1,673 | $26,042 | $7,860 | $18,182 |
Source: Public Records
Map
Nearby Homes
- 1823 Michigan Ave W
- 163 Spaulding Ave W
- 35 Avery Ave
- 53 Lamora Ave
- 84 Lamora Ave
- 1528 Michigan Ave W
- 180 Woodlawn Ave N
- 116 Geneva Ave
- 213 Broadway Blvd
- 232 Woodlawn Ave N
- 244 Woodlawn Ave N
- 33 Shellenberger Ave
- 81 Taylor Ave
- 40 Kellogg St
- 133 Mosher Ave
- 430 Presidential Dr
- 420 Presidential Dr
- 112 Feld Ave
- 217 Creekview Dr
- 338 Cross St
- 1723 Michigan Ave W
- 1733 Michigan Ave W
- 1739 Michigan Ave W
- 1743 Michigan Ave W
- 1700 W Michigan Ave
- 31 Stringham Rd
- 1744 Michigan Ave W
- 14 Broadway Blvd
- 0 Struwin Rd
- 18 Broadway Blvd
- 1750 Michigan Ave W
- 20 Stringham Rd
- 24 Broadway Blvd
- 17 Broadway Blvd
- 28 Stringham Rd
- 13 Woodlawn Ave S
- 28 Broadway Blvd
- 1767 Michigan Ave W
- 1686 Michigan Ave W
- 27 Broadway Blvd