1725 N Mohawk St Unit 2N Chicago, IL 60614
Old Town NeighborhoodEstimated Value: $590,000 - $1,012,000
--
Bed
--
Bath
12,555
Sq Ft
$59/Sq Ft
Est. Value
About This Home
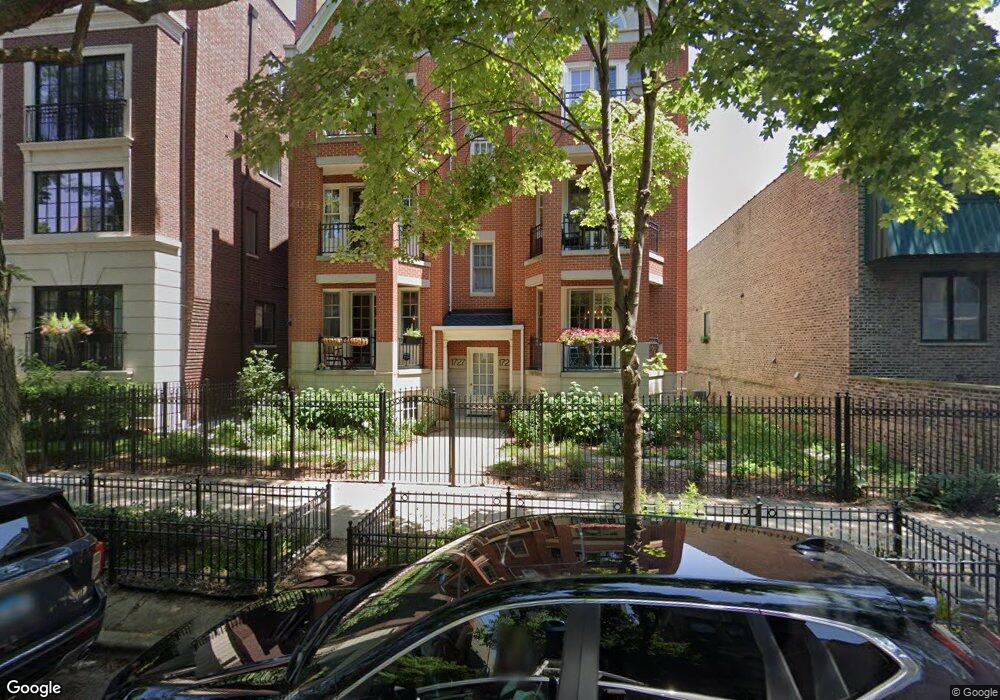
This home is located at 1725 N Mohawk St Unit 2N, Chicago, IL 60614 and is currently estimated at $735,842, approximately $58 per square foot. 1725 N Mohawk St Unit 2N is a home located in Cook County with nearby schools including Abraham Lincoln Elementary School, Lincoln Park High School, and Immaculate Conception - St. Joseph School.
Ownership History
Date
Name
Owned For
Owner Type
Purchase Details
Closed on
Jun 10, 2024
Sold by
Andrzej Karwowski Living Trust and Karwowski Andrzej
Bought by
Asadi Alireza
Current Estimated Value
Home Financials for this Owner
Home Financials are based on the most recent Mortgage that was taken out on this home.
Original Mortgage
$189,300
Outstanding Balance
$12,716
Interest Rate
1.3%
Mortgage Type
New Conventional
Estimated Equity
$723,126
Purchase Details
Closed on
Sep 7, 2018
Sold by
Karwowski Andrzej
Bought by
Karwowski Andrzej and Andrzej Karwowski Living Trust
Purchase Details
Closed on
Dec 8, 2014
Sold by
Hackett Rosemary T
Bought by
Karwowski Andrzej
Home Financials for this Owner
Home Financials are based on the most recent Mortgage that was taken out on this home.
Original Mortgage
$330,000
Interest Rate
4%
Mortgage Type
Future Advance Clause Open End Mortgage
Create a Home Valuation Report for This Property
The Home Valuation Report is an in-depth analysis detailing your home's value as well as a comparison with similar homes in the area
Home Values in the Area
Average Home Value in this Area
Purchase History
| Date | Buyer | Sale Price | Title Company |
|---|---|---|---|
| Asadi Alireza | $631,000 | Chicago Title | |
| Karwowski Andrzej | -- | Attorney | |
| Karwowski Andrzej | $450,000 | Ctt |
Source: Public Records
Mortgage History
| Date | Status | Borrower | Loan Amount |
|---|---|---|---|
| Open | Asadi Alireza | $189,300 | |
| Open | Asadi Alireza | $378,600 | |
| Previous Owner | Karwowski Andrzej | $330,000 |
Source: Public Records
Tax History Compared to Growth
Tax History
| Year | Tax Paid | Tax Assessment Tax Assessment Total Assessment is a certain percentage of the fair market value that is determined by local assessors to be the total taxable value of land and additions on the property. | Land | Improvement |
|---|---|---|---|---|
| 2024 | $6,685 | $63,135 | $10,223 | $52,912 |
| 2023 | $6,495 | $35,000 | $8,244 | $26,756 |
| 2022 | $6,495 | $35,000 | $8,244 | $26,756 |
| 2021 | $7,038 | $34,999 | $8,244 | $26,755 |
| 2020 | $7,769 | $34,873 | $7,254 | $27,619 |
| 2019 | $7,610 | $37,876 | $7,254 | $30,622 |
| 2018 | $7,482 | $37,876 | $7,254 | $30,622 |
| 2017 | $9,997 | $46,440 | $5,935 | $40,505 |
| 2016 | $9,301 | $46,440 | $5,935 | $40,505 |
| 2015 | $8,510 | $46,440 | $5,935 | $40,505 |
| 2014 | $4,946 | $29,225 | $4,451 | $24,774 |
| 2013 | $4,837 | $29,225 | $4,451 | $24,774 |
Source: Public Records
Map
Nearby Homes
- 1733 N Mohawk St Unit 3N
- 1720 N Mohawk St
- 1715 N Larrabee St Unit 1S
- 1733 N Larrabee St
- 505 W Menomonee St
- 1648 N Cleveland Ave
- 557 W Eugenie St Unit 557
- 1623 N Mohawk St
- 1626 N Larrabee St
- 1714 N Sedgwick St
- 1849 N Mohawk St Unit 2
- 1848 N Hudson Ave Unit G
- 1630 N Sedgwick St Unit 2
- 437 W North Ave Unit 404
- 328 W Concord Place
- 1646 N Orchard St Unit PHS
- 1646 N Orchard St Unit 2
- 1719 N Burling St Unit 2S
- 1547 N Hudson Ave Unit 1
- 1543 N Hudson Ave Unit 2
- 1725 N Mohawk St Unit 3N
- 1725 N Mohawk St Unit 2S
- 1725 N Mohawk St Unit 1S
- 1725 N Mohawk St Unit 3S
- 1725 N Mohawk St Unit 1N
- 1727 N Mohawk St Unit 3N
- 1727 N Mohawk St Unit 1N
- 1727 N Mohawk St Unit 2N
- 1727 N Mohawk St Unit 3N
- 1727 N Mohawk St
- 1719 N Mohawk St
- 1719 N Mohawk St
- 1719 N Mohawk St
- 1719 N Mohawk St
- 1719 N Mohawk St Unit G
- 1719 N Mohawk St Unit H
- 1731 N Mohawk St
- 1733 N Mohawk St
- 1733 N Mohawk St Unit 1N
- 1733 N Mohawk St Unit 2