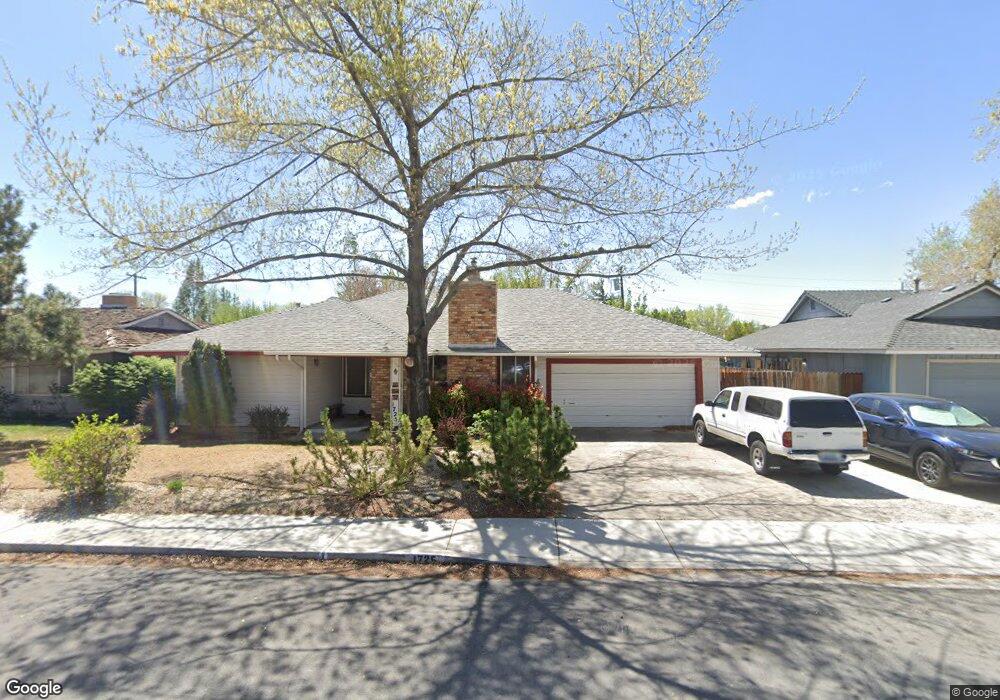
1725 Plymouth Way Sparks, NV 89431
North Rock NeighborhoodEstimated Value: $407,893 - $464,000
4
Beds
2
Baths
1,398
Sq Ft
$309/Sq Ft
Est. Value
About This Home
This home is located at 1725 Plymouth Way, Sparks, NV 89431 and is currently estimated at $431,723, approximately $308 per square foot. 1725 Plymouth Way is a home located in Washoe County with nearby schools including Alice Maxwell Elementary School, Sparks Middle School, and Sparks High School.
Ownership History
Date
Name
Owned For
Owner Type
Purchase Details
Closed on
May 8, 2008
Sold by
Ling Andrew
Bought by
Griffith William G and Cheatham Griffith Susan
Current Estimated Value
Home Financials for this Owner
Home Financials are based on the most recent Mortgage that was taken out on this home.
Original Mortgage
$206,755
Outstanding Balance
$130,868
Interest Rate
5.87%
Mortgage Type
FHA
Estimated Equity
$300,855
Purchase Details
Closed on
Jan 13, 2003
Sold by
Robbins Kenneth R and Robbins Emily R
Bought by
Ling Andrew
Home Financials for this Owner
Home Financials are based on the most recent Mortgage that was taken out on this home.
Original Mortgage
$128,800
Interest Rate
6.15%
Purchase Details
Closed on
Aug 4, 1995
Sold by
Robbins Kenneth R and Robbins Emily R
Bought by
Robbins Kenneth R and Robbins Emily R
Create a Home Valuation Report for This Property
The Home Valuation Report is an in-depth analysis detailing your home's value as well as a comparison with similar homes in the area
Home Values in the Area
Average Home Value in this Area
Purchase History
| Date | Buyer | Sale Price | Title Company |
|---|---|---|---|
| Griffith William G | $210,000 | First Centennial Reno | |
| Ling Andrew | $161,000 | Western Title Incorporated | |
| Robbins Kenneth R | -- | -- |
Source: Public Records
Mortgage History
| Date | Status | Borrower | Loan Amount |
|---|---|---|---|
| Open | Griffith William G | $206,755 | |
| Previous Owner | Ling Andrew | $128,800 |
Source: Public Records
Tax History Compared to Growth
Tax History
| Year | Tax Paid | Tax Assessment Tax Assessment Total Assessment is a certain percentage of the fair market value that is determined by local assessors to be the total taxable value of land and additions on the property. | Land | Improvement |
|---|---|---|---|---|
| 2025 | $927 | $56,647 | $34,825 | $21,822 |
| 2024 | $927 | $51,672 | $30,205 | $21,467 |
| 2023 | $902 | $51,652 | $31,780 | $19,872 |
| 2022 | $876 | $43,361 | $27,160 | $16,201 |
| 2021 | $849 | $34,022 | $18,235 | $15,787 |
| 2020 | $823 | $33,343 | $17,850 | $15,493 |
| 2019 | $799 | $32,284 | $17,605 | $14,679 |
| 2018 | $776 | $26,451 | $12,355 | $14,096 |
| 2017 | $754 | $25,084 | $11,235 | $13,849 |
| 2016 | $734 | $23,596 | $9,765 | $13,831 |
| 2015 | $733 | $22,396 | $8,645 | $13,751 |
| 2014 | $712 | $20,107 | $6,335 | $13,772 |
| 2013 | -- | $18,989 | $4,900 | $14,089 |
Source: Public Records
Map
Nearby Homes
- 1731 Gault Way Unit D
- 1595 York Way
- 1620 Gault Way
- 2154 Oppio St
- 1799 Vance Way
- 1345 Plymouth Way
- 1655 Byrd Dr
- 0 N Mccarran Blvd Unit 250052909
- 1160 York Way
- 1125 Dodson Way
- 1110 Xman Way
- 1780 Greenbrae Dr
- 3269 Valley Forge Way
- 1124 Sbragia Way
- 3116 Sterling Ridge Cir
- 1855 Verano Dr
- 1365 Prospect Ave
- 1121 Greenbrae Dr
- 3516 Brassie Dr
- 3230 Creekside Ln Unit 1
- 1735 Plymouth Way
- 1705 Plymouth Way
- 1720 Zephyr Way
- 1700 Zephyr Way
- 1695 Plymouth Way Unit 7A
- 1755 Plymouth Way
- 1720 Plymouth Way
- 1710 Plymouth Way
- 1750 Zephyr Way
- 1690 Zephyr Way
- 1730 Plymouth Way
- 1730 Zephyr Way
- 1690 Plymouth Way
- 1761 Plymouth Way
- 1685 Plymouth Way
- 1760 Plymouth Way
- 1766 Zephyr Way
- 1680 Zephyr Way
- 1680 Plymouth Way
- 1741 Sue Way Unit D