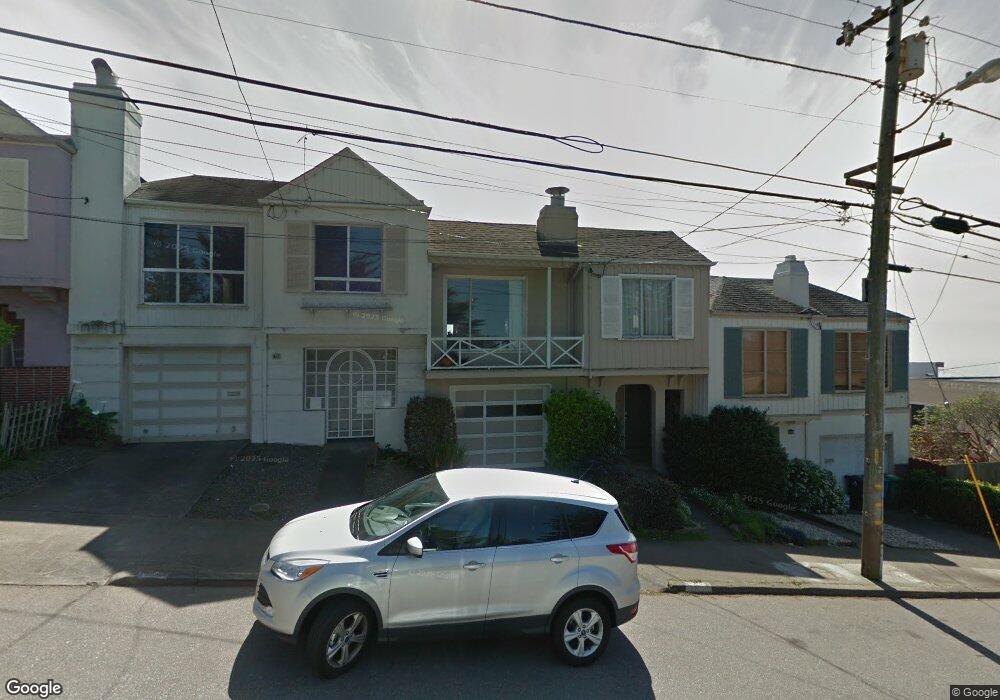
1725 Quintara St San Francisco, CA 94116
Parkside NeighborhoodEstimated Value: $1,118,970 - $1,656,000
--
Bed
1
Bath
1,036
Sq Ft
$1,271/Sq Ft
Est. Value
About This Home
This home is located at 1725 Quintara St, San Francisco, CA 94116 and is currently estimated at $1,317,243, approximately $1,271 per square foot. 1725 Quintara St is a home located in San Francisco County with nearby schools including Dianne Feinstein Elementary, Aptos Middle School, and Cornerstone Academy-Lawton Campus.
Ownership History
Date
Name
Owned For
Owner Type
Purchase Details
Closed on
Mar 16, 2018
Sold by
Soohoo Roger H and Soohoo Lily P
Bought by
Soohoo Roger H and Soohoo Lily P
Current Estimated Value
Purchase Details
Closed on
Feb 20, 2003
Sold by
Soohoo Roger and Soohoo Lily
Bought by
Soohoo Roger H and Soohoo Lily P
Home Financials for this Owner
Home Financials are based on the most recent Mortgage that was taken out on this home.
Original Mortgage
$97,000
Interest Rate
5.83%
Purchase Details
Closed on
Nov 5, 1991
Sold by
Hoo Roger H Soo and Hoo Lily P Soo
Bought by
Hoo Roger Soo and Hoo Lily Soo
Create a Home Valuation Report for This Property
The Home Valuation Report is an in-depth analysis detailing your home's value as well as a comparison with similar homes in the area
Home Values in the Area
Average Home Value in this Area
Purchase History
| Date | Buyer | Sale Price | Title Company |
|---|---|---|---|
| Soohoo Roger H | -- | None Available | |
| Soohoo Roger H | -- | First American Title Company | |
| Hoo Roger Soo | -- | -- |
Source: Public Records
Mortgage History
| Date | Status | Borrower | Loan Amount |
|---|---|---|---|
| Closed | Soohoo Roger H | $97,000 |
Source: Public Records
Tax History Compared to Growth
Tax History
| Year | Tax Paid | Tax Assessment Tax Assessment Total Assessment is a certain percentage of the fair market value that is determined by local assessors to be the total taxable value of land and additions on the property. | Land | Improvement |
|---|---|---|---|---|
| 2025 | $5,049 | $370,914 | $214,743 | $156,171 |
| 2024 | $5,049 | $363,642 | $210,533 | $153,109 |
| 2023 | $4,965 | $356,512 | $206,405 | $150,107 |
| 2022 | $4,856 | $349,522 | $202,358 | $147,164 |
| 2021 | $4,766 | $342,670 | $198,391 | $144,279 |
| 2020 | $4,855 | $339,157 | $196,357 | $142,800 |
| 2019 | $4,644 | $332,507 | $192,507 | $140,000 |
| 2018 | $4,490 | $325,988 | $188,733 | $137,255 |
| 2017 | $4,139 | $319,597 | $185,033 | $134,564 |
| 2016 | $4,047 | $313,331 | $181,405 | $131,926 |
| 2015 | $3,995 | $308,626 | $178,681 | $129,945 |
| 2014 | $3,891 | $302,581 | $175,181 | $127,400 |
Source: Public Records
Map
Nearby Homes