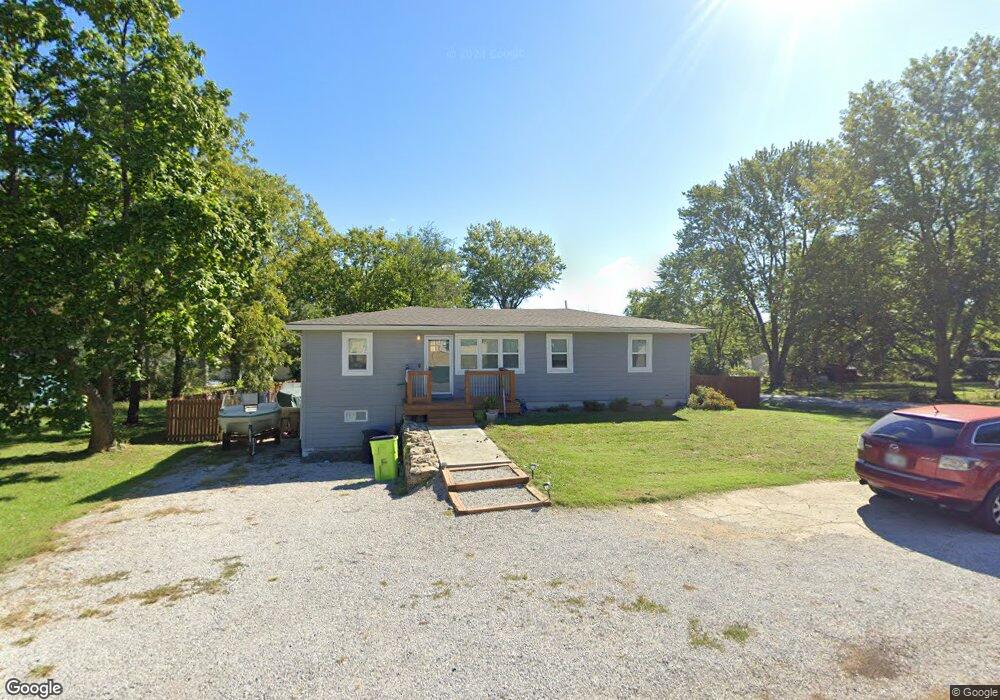
17259 Montgall Dr Belton, MO 64012
Estimated Value: $207,000 - $216,000
3
Beds
1
Bath
1,128
Sq Ft
$189/Sq Ft
Est. Value
About This Home
This home is located at 17259 Montgall Dr, Belton, MO 64012 and is currently estimated at $212,907, approximately $188 per square foot. 17259 Montgall Dr is a home located in Cass County with nearby schools including Cambridge Elementary School, Mill Creek Upper Elementary School, and Belton Middle School.
Ownership History
Date
Name
Owned For
Owner Type
Purchase Details
Closed on
Oct 31, 2022
Sold by
Bisel Kenneth C and Bisel Denise E
Bought by
Bisel Brittney
Current Estimated Value
Home Financials for this Owner
Home Financials are based on the most recent Mortgage that was taken out on this home.
Original Mortgage
$145,706
Outstanding Balance
$140,824
Interest Rate
6.7%
Mortgage Type
FHA
Estimated Equity
$72,083
Purchase Details
Closed on
Feb 8, 2018
Sold by
Jpmorgan Chase Bank Na
Bought by
Bisel Kenneth C and Bisel Denise E
Purchase Details
Closed on
Dec 13, 2016
Sold by
Secretary Of Hud
Bought by
Jpmorgan Chase Bank Na
Purchase Details
Closed on
Sep 8, 2016
Sold by
Jpmorgan Chase Bank National Associat
Bought by
Housing & Urban Development
Purchase Details
Closed on
Jan 29, 2013
Sold by
Mayo Teresa L and Mayo Russell W
Bought by
Jpmorgan Case Bank N A
Create a Home Valuation Report for This Property
The Home Valuation Report is an in-depth analysis detailing your home's value as well as a comparison with similar homes in the area
Home Values in the Area
Average Home Value in this Area
Purchase History
| Date | Buyer | Sale Price | Title Company |
|---|---|---|---|
| Bisel Brittney | -- | Kansas City Title | |
| Bisel Kenneth C | $109,252 | Bay National Title Company | |
| Jpmorgan Chase Bank Na | -- | None Available | |
| Housing & Urban Development | -- | -- | |
| Jpmorgan Case Bank N A | -- | None Available |
Source: Public Records
Mortgage History
| Date | Status | Borrower | Loan Amount |
|---|---|---|---|
| Open | Bisel Brittney | $145,706 |
Source: Public Records
Tax History Compared to Growth
Tax History
| Year | Tax Paid | Tax Assessment Tax Assessment Total Assessment is a certain percentage of the fair market value that is determined by local assessors to be the total taxable value of land and additions on the property. | Land | Improvement |
|---|---|---|---|---|
| 2024 | $1,267 | $15,370 | $1,920 | $13,450 |
| 2023 | $1,264 | $15,370 | $1,920 | $13,450 |
| 2022 | $1,111 | $13,390 | $1,920 | $11,470 |
| 2021 | $1,111 | $13,390 | $1,920 | $11,470 |
| 2020 | $1,093 | $13,090 | $1,920 | $11,170 |
| 2019 | $1,070 | $13,090 | $1,920 | $11,170 |
| 2018 | $938 | $11,570 | $1,540 | $10,030 |
| 2017 | $898 | $11,570 | $1,540 | $10,030 |
| 2016 | $898 | $11,020 | $1,540 | $9,480 |
| 2015 | $898 | $11,020 | $1,540 | $9,480 |
| 2014 | $901 | $11,020 | $1,540 | $9,480 |
| 2013 | -- | $11,020 | $1,540 | $9,480 |
Source: Public Records
Map
Nearby Homes
- 17249 Chestnut Dr
- 17244 Montgall Dr
- 17405 S Benton Dr
- 17417 S Benton Dr
- 17210 Montgall Dr
- 911 Tanner Cir
- 203 Monroe Ave
- 311 Kimberly Dr
- 303 Kimberly Dr
- 205 N Cleveland Ave
- 401 Kimberly Dr
- 309 N Cleveland Ave
- 517 Stacey Dr
- 522 Hargis Ln
- 104 London Way
- 511 Sunset Ln
- 000 Miller Dr
- 405 N Cleveland Ave
- 601 Eldorado Cir
- 315 W North Ave
- 17253 Montgall Dr
- 17401 Montgall Dr
- 2710 E 174th St
- 17252 Chestnut Dr
- 17251 Montgall Dr
- 17258 Montgall Dr
- 17402 Chestnut Dr
- 17252 Montgall Dr
- 17250 Chestnut Dr
- 17402 Montgall Dr
- 17405 Montgall Dr
- 17250 Montgall Dr
- 17247 Montgall Dr
- 17406 Chestnut Dr
- 17406 Montgall Dr
- 17248 Chestnut Dr
- 17409 Montgall Dr
- 17248 Montgall Dr
- 17261 S Prospect Ave
- 17251 Chestnut Dr