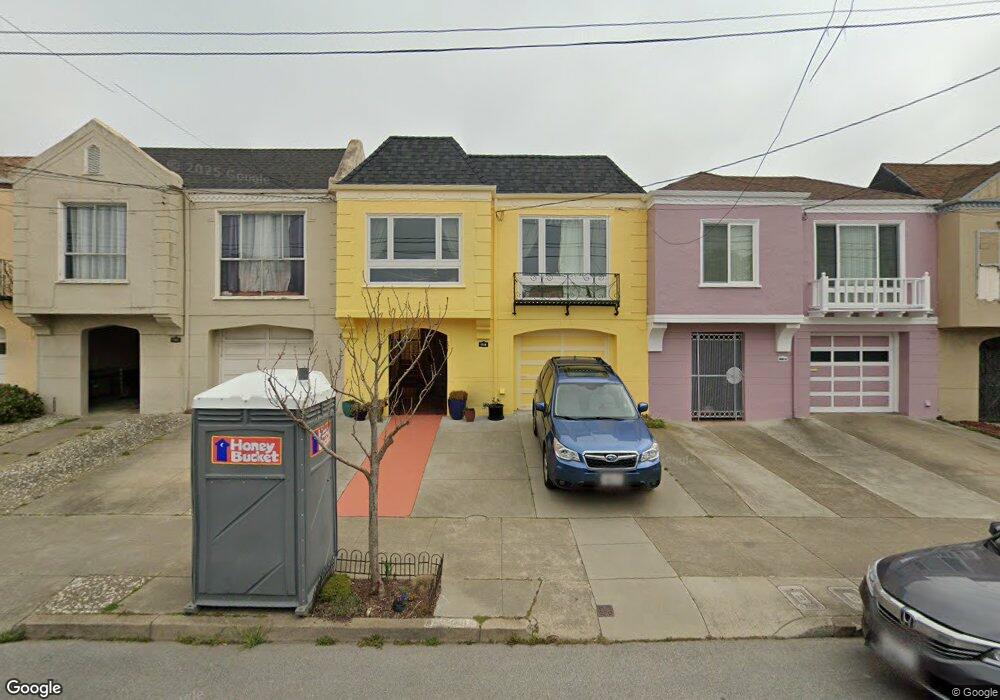
1726 39th Ave San Francisco, CA 94122
Outer Sunset NeighborhoodEstimated Value: $1,316,000 - $1,598,000
2
Beds
1
Bath
1,288
Sq Ft
$1,159/Sq Ft
Est. Value
About This Home
This home is located at 1726 39th Ave, San Francisco, CA 94122 and is currently estimated at $1,492,972, approximately $1,159 per square foot. 1726 39th Ave is a home located in San Francisco County with nearby schools including Key (Francis Scott) Elementary School, Giannini (A.P.) Middle School, and Holy Name Elementary School.
Ownership History
Date
Name
Owned For
Owner Type
Purchase Details
Closed on
Aug 31, 2022
Sold by
Severin Nordberg Michael and Severin Marie Suzanne
Bought by
Nordberg Murphy Trust
Current Estimated Value
Purchase Details
Closed on
May 31, 2002
Sold by
Sui May
Bought by
Nordberg Michael S and Murphy Suzanne M
Home Financials for this Owner
Home Financials are based on the most recent Mortgage that was taken out on this home.
Original Mortgage
$452,000
Interest Rate
6.25%
Mortgage Type
Purchase Money Mortgage
Purchase Details
Closed on
Mar 17, 1999
Sold by
Sui Suzanne S and Wang Eugene
Bought by
Sui May
Home Financials for this Owner
Home Financials are based on the most recent Mortgage that was taken out on this home.
Original Mortgage
$180,000
Interest Rate
6.73%
Create a Home Valuation Report for This Property
The Home Valuation Report is an in-depth analysis detailing your home's value as well as a comparison with similar homes in the area
Home Values in the Area
Average Home Value in this Area
Purchase History
| Date | Buyer | Sale Price | Title Company |
|---|---|---|---|
| Nordberg Murphy Trust | -- | -- | |
| Nordberg Michael S | $565,000 | Chicago Title Co | |
| Sui May | -- | North American Title Co |
Source: Public Records
Mortgage History
| Date | Status | Borrower | Loan Amount |
|---|---|---|---|
| Previous Owner | Nordberg Michael S | $452,000 | |
| Previous Owner | Sui May | $180,000 | |
| Closed | Nordberg Michael S | $56,500 |
Source: Public Records
Tax History Compared to Growth
Tax History
| Year | Tax Paid | Tax Assessment Tax Assessment Total Assessment is a certain percentage of the fair market value that is determined by local assessors to be the total taxable value of land and additions on the property. | Land | Improvement |
|---|---|---|---|---|
| 2025 | $10,447 | $848,042 | $500,794 | $347,248 |
| 2024 | $10,447 | $831,415 | $490,975 | $340,440 |
| 2023 | $10,283 | $815,115 | $481,349 | $333,766 |
| 2022 | $10,078 | $799,133 | $471,911 | $327,222 |
| 2021 | $9,895 | $783,465 | $462,658 | $320,807 |
| 2020 | $9,950 | $775,434 | $457,915 | $317,519 |
| 2019 | $9,609 | $760,231 | $448,937 | $311,294 |
| 2018 | $9,285 | $745,326 | $440,135 | $305,191 |
| 2017 | $8,876 | $730,713 | $431,505 | $299,208 |
| 2016 | $8,717 | $716,387 | $423,045 | $293,342 |
| 2015 | $8,607 | $705,628 | $416,691 | $288,937 |
| 2014 | $8,380 | $691,807 | $408,529 | $283,278 |
Source: Public Records
Map
Nearby Homes
- 1834 38th Ave
- 1735 35th Ave
- 1563 43rd Ave
- 1586 44th Ave
- 1871 45th Ave
- 1970 35th Ave
- 1459 34th Ave
- 3917 Noriega St
- 4108 Moraga St Unit 4110
- 1501 46th Ave
- 4201 Kirkham St
- 1375 43rd Ave
- 1538 48th Ave
- 3409-3411 Irving St
- 1726 30th Ave
- 2115 42nd Ave
- 1675 29th Ave
- 1580 Great Hwy Unit 4
- 2142 43rd Ave
- 1735 28th Ave