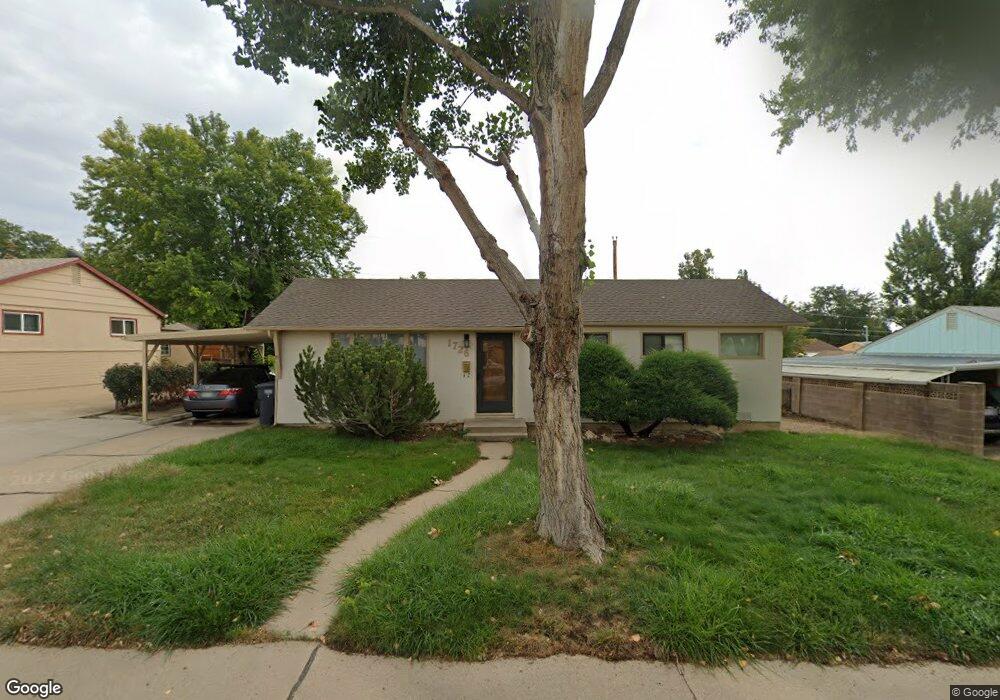
1726 Comanche Rd Pueblo, CO 81001
Belmont NeighborhoodEstimated Value: $218,000 - $251,000
3
Beds
1
Bath
1,075
Sq Ft
$215/Sq Ft
Est. Value
About This Home
This home is located at 1726 Comanche Rd, Pueblo, CO 81001 and is currently estimated at $231,547, approximately $215 per square foot. 1726 Comanche Rd is a home located in Pueblo County with nearby schools including Haaff Elementary School, Heaton Middle School, and East High School.
Ownership History
Date
Name
Owned For
Owner Type
Purchase Details
Closed on
Jul 17, 2019
Sold by
Clark Dumont F
Bought by
Clark Darren
Current Estimated Value
Purchase Details
Closed on
Mar 13, 1998
Sold by
Algien Kenneth A
Bought by
Clark Dumont F + Darren
Purchase Details
Closed on
Sep 29, 1992
Sold by
Clark Shirley A
Bought by
Algien Kenneth A
Purchase Details
Closed on
Nov 13, 1985
Sold by
Garcia R E + S M
Bought by
Clark Shirley A
Purchase Details
Closed on
Apr 30, 1980
Sold by
Garcia Robert D
Bought by
Garcia R E + S M
Purchase Details
Closed on
Apr 11, 1980
Sold by
Garcia Robert D + Corrine
Bought by
Garcia Robert D
Purchase Details
Closed on
Jan 18, 1978
Sold by
Scully Richard W + Carol J
Bought by
Garcia Robert D + Corinne
Purchase Details
Closed on
Jun 2, 1972
Sold by
Scully and Ketchum
Bought by
Scully Richard W + Carol J
Purchase Details
Closed on
Apr 10, 1972
Sold by
Ketchum and Scully
Bought by
Scully and Ketchum
Create a Home Valuation Report for This Property
The Home Valuation Report is an in-depth analysis detailing your home's value as well as a comparison with similar homes in the area
Home Values in the Area
Average Home Value in this Area
Purchase History
| Date | Buyer | Sale Price | Title Company |
|---|---|---|---|
| Clark Darren | -- | None Available | |
| Clark Dumont F + Darren | $80,000 | -- | |
| Algien Kenneth A | $45,900 | -- | |
| Clark Shirley A | $40,700 | -- | |
| Garcia R E + S M | -- | -- | |
| Garcia Robert D | -- | -- | |
| Garcia Robert D + Corinne | $33,900 | -- | |
| Scully Richard W + Carol J | $15,500 | -- | |
| Scully | -- | -- |
Source: Public Records
Tax History Compared to Growth
Tax History
| Year | Tax Paid | Tax Assessment Tax Assessment Total Assessment is a certain percentage of the fair market value that is determined by local assessors to be the total taxable value of land and additions on the property. | Land | Improvement |
|---|---|---|---|---|
| 2024 | $885 | $9,000 | -- | -- |
| 2023 | $896 | $12,690 | $1,340 | $11,350 |
| 2022 | $968 | $9,750 | $1,390 | $8,360 |
| 2021 | $999 | $10,030 | $1,430 | $8,600 |
| 2020 | $786 | $10,030 | $1,430 | $8,600 |
| 2019 | $787 | $7,796 | $644 | $7,152 |
| 2018 | $583 | $6,434 | $648 | $5,786 |
| 2017 | $589 | $6,434 | $648 | $5,786 |
| 2016 | $565 | $6,219 | $716 | $5,503 |
| 2015 | $281 | $6,219 | $716 | $5,503 |
| 2014 | $274 | $6,048 | $716 | $5,332 |
Source: Public Records
Map
Nearby Homes
- 1706 Comanche Rd
- 1701 Jerry Murphy Rd
- 1814 Lark Bunting Ln
- 36 Scotland Rd
- 11 Macnaughton Rd
- 1827 Seminole Ln
- 5 Douglas Ln
- 2 Hilton Ln
- 2 Alan Shepard Rd Unit 8
- 18 Dundee Ln
- 39 Apollo Ln
- 1426 Bonforte Blvd
- 1909 Mohawk Rd
- 1925 Mohawk Rd
- 55 Bonnymede Rd Unit S
- 55 Bonnymede Rd
- 130 Scotland Rd Unit D
- 172 Bonnymede Rd
- 172 Bonnymede Rd Unit A
- 172 Bonnymede Rd Unit C
- 1728 Comanche Rd
- 1724 Comanche Rd
- 1725 Iroquois Rd
- 1723 Iroquois Rd
- 1730 Comanche Rd
- 1722 Comanche Rd
- 1729 Iroquois Rd
- 1725 Comanche Rd
- 1727 Comanche Rd
- 1721 Iroquois Rd
- 1723 Comanche Rd
- 1729 Comanche Rd
- 1732 Comanche Rd
- 1731 Iroquois Rd
- 1720 Comanche Rd
- 1721 Comanche Rd
- 1731 Comanche Rd
- 1724 Iroquois Rd
- 1719 Iroquois Rd
- 10 Caledonia Rd