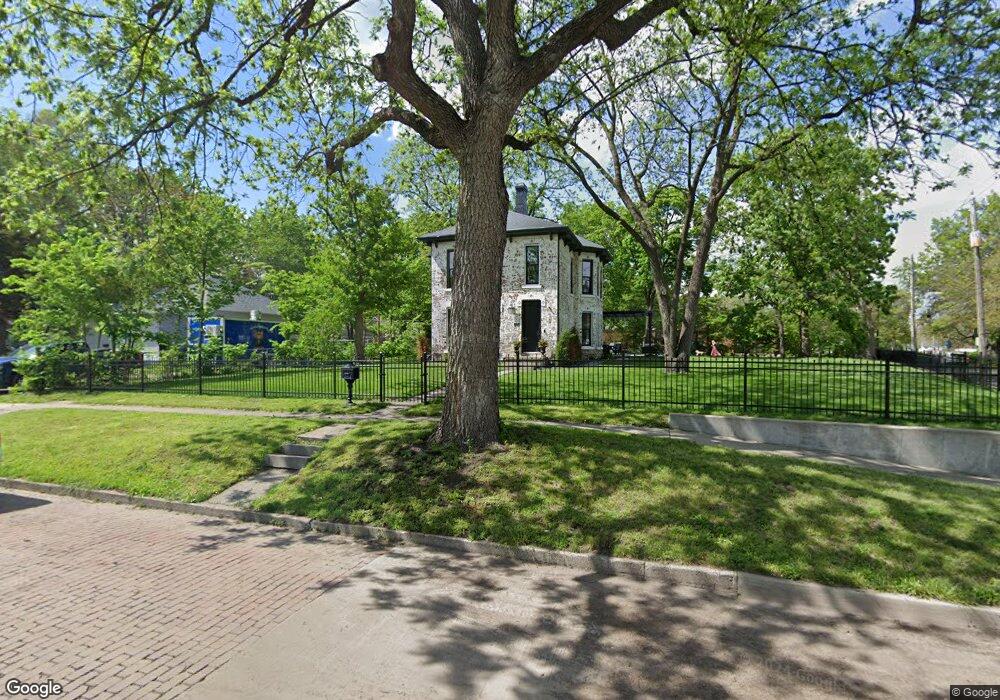
1726 Logan Ave Des Moines, IA 50316
Capitol East NeighborhoodEstimated Value: $227,000 - $272,000
4
Beds
2
Baths
2,290
Sq Ft
$109/Sq Ft
Est. Value
About This Home
This home is located at 1726 Logan Ave, Des Moines, IA 50316 and is currently estimated at $249,610, approximately $109 per square foot. 1726 Logan Ave is a home located in Polk County with nearby schools including Capitol View Elementary School, Hiatt Middle School, and East High School.
Ownership History
Date
Name
Owned For
Owner Type
Purchase Details
Closed on
Jun 15, 2021
Sold by
Conn David
Bought by
Baltimore Francis D and 01Leake Chayoe Christian
Current Estimated Value
Home Financials for this Owner
Home Financials are based on the most recent Mortgage that was taken out on this home.
Original Mortgage
$224,000
Outstanding Balance
$202,362
Interest Rate
2.9%
Mortgage Type
New Conventional
Estimated Equity
$47,248
Purchase Details
Closed on
Oct 30, 2017
Sold by
Roth James J and Weis Mark
Bought by
Conn David
Purchase Details
Closed on
Apr 3, 2003
Sold by
First National Acceptance Co
Bought by
Goodman David D and Goodman Trudy A
Purchase Details
Closed on
Mar 14, 2000
Sold by
Oconnell Mary Anne
Bought by
First National Acceptance Company
Purchase Details
Closed on
Feb 7, 1997
Sold by
Welch Marguerite A
Bought by
Oconnell Mary Anne
Create a Home Valuation Report for This Property
The Home Valuation Report is an in-depth analysis detailing your home's value as well as a comparison with similar homes in the area
Home Values in the Area
Average Home Value in this Area
Purchase History
| Date | Buyer | Sale Price | Title Company |
|---|---|---|---|
| Baltimore Francis D | $175,000 | None Listed On Document | |
| Conn David | $85,000 | None Available | |
| Goodman David D | $55,000 | -- | |
| First National Acceptance Company | -- | -- | |
| Oconnell Mary Anne | $36,500 | -- |
Source: Public Records
Mortgage History
| Date | Status | Borrower | Loan Amount |
|---|---|---|---|
| Open | Baltimore Francis D | $224,000 |
Source: Public Records
Tax History
| Year | Tax Paid | Tax Assessment Tax Assessment Total Assessment is a certain percentage of the fair market value that is determined by local assessors to be the total taxable value of land and additions on the property. | Land | Improvement |
|---|---|---|---|---|
| 2025 | $4,084 | $269,500 | $19,900 | $249,600 |
| 2024 | $4,084 | $218,100 | $17,400 | $200,700 |
| 2023 | $4,042 | $233,400 | $17,400 | $216,000 |
| 2022 | $3,272 | $180,400 | $14,100 | $166,300 |
| 2021 | $3,052 | $139,900 | $14,100 | $125,800 |
| 2020 | $3,170 | $122,300 | $12,400 | $109,900 |
| 2019 | $2,766 | $122,300 | $12,400 | $109,900 |
| 2018 | $2,738 | $102,900 | $10,300 | $92,600 |
| 2017 | $2,582 | $102,900 | $10,300 | $92,600 |
| 2016 | $2,516 | $95,500 | $9,500 | $86,000 |
| 2015 | $2,516 | $95,500 | $9,500 | $86,000 |
| 2014 | $2,432 | $91,500 | $9,400 | $82,100 |
Source: Public Records
Map
Nearby Homes
- 1820 E Walnut St
- 1609 E Court Ave
- 1841 Des Moines St
- 1610 E Grand Ave
- 1621 Des Moines St
- 2024 Capitol Ave
- 2048 E Walnut St
- 1929 Burson St
- 104 E 15th St
- 2158 E Walnut St
- 2101 Lyon St
- 2216 Logan Ave
- 2057 Maple St
- 2300 Dean Ave
- 1211 Sampson St
- 1213 Sampson St
- 1241 E 17th Ct
- 2228 Lyon St
- 1273 E 18th St
- 2238 Lyon St
- 1716 Logan Ave
- 1808 Logan Ave
- 1714 Logan Ave
- 1723 E Walnut St
- 273 E 18th St
- 1710 Logan Ave
- 255 E 18th St
- 1715 E Walnut St
- 1810 Logan Ave
- 1706 Logan Ave
- 261 E 17th St
- 257 E 17th St
- 249 E 18th St
- 1814 Logan Ave
- 1801 E Walnut St
- 1707 E Walnut St
- 1815 Logan Ave
- 1702 Logan Ave
- 269 E 17th St
- 1805 E Walnut St
Your Personal Tour Guide
Ask me questions while you tour the home.