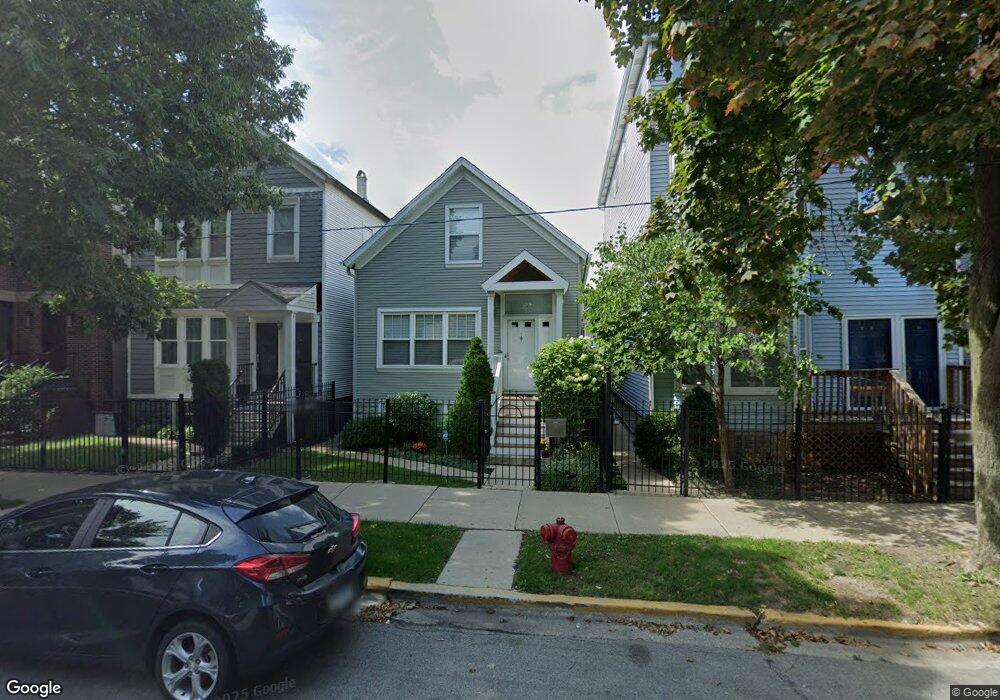
1726 N Campbell Ave Chicago, IL 60647
Wicker Park NeighborhoodEstimated Value: $756,000 - $881,000
3
Beds
2
Baths
1,291
Sq Ft
$625/Sq Ft
Est. Value
About This Home
This home is located at 1726 N Campbell Ave, Chicago, IL 60647 and is currently estimated at $807,042, approximately $625 per square foot. 1726 N Campbell Ave is a home located in Cook County with nearby schools including Moos Elementary School, Clemente Community Academy High School, and Erie Elementary Charter School.
Ownership History
Date
Name
Owned For
Owner Type
Purchase Details
Closed on
May 12, 2004
Sold by
Bulger John L
Bought by
Chapdelaine John C and Chapdelaine Gwen
Current Estimated Value
Purchase Details
Closed on
Oct 22, 2001
Sold by
Skyner Wesley Gary
Bought by
Bulger John L
Home Financials for this Owner
Home Financials are based on the most recent Mortgage that was taken out on this home.
Original Mortgage
$280,000
Interest Rate
8.25%
Create a Home Valuation Report for This Property
The Home Valuation Report is an in-depth analysis detailing your home's value as well as a comparison with similar homes in the area
Home Values in the Area
Average Home Value in this Area
Purchase History
| Date | Buyer | Sale Price | Title Company |
|---|---|---|---|
| Chapdelaine John C | $435,000 | Multiple | |
| Bulger John L | $125,000 | -- |
Source: Public Records
Mortgage History
| Date | Status | Borrower | Loan Amount |
|---|---|---|---|
| Previous Owner | Bulger John L | $280,000 |
Source: Public Records
Tax History Compared to Growth
Tax History
| Year | Tax Paid | Tax Assessment Tax Assessment Total Assessment is a certain percentage of the fair market value that is determined by local assessors to be the total taxable value of land and additions on the property. | Land | Improvement |
|---|---|---|---|---|
| 2024 | $10,744 | $48,471 | $17,500 | $30,971 |
| 2023 | $10,420 | $54,084 | $14,063 | $40,021 |
| 2022 | $10,420 | $54,084 | $14,063 | $40,021 |
| 2021 | $10,206 | $54,083 | $14,062 | $40,021 |
| 2020 | $7,998 | $39,004 | $7,968 | $31,036 |
| 2019 | $8,018 | $43,338 | $7,968 | $35,370 |
| 2018 | $9,094 | $49,474 | $7,968 | $41,506 |
| 2017 | $3,896 | $21,472 | $7,031 | $14,441 |
| 2016 | $3,800 | $21,472 | $7,031 | $14,441 |
| 2015 | $3,454 | $21,472 | $7,031 | $14,441 |
| 2014 | $3,469 | $21,266 | $6,250 | $15,016 |
| 2013 | $3,389 | $21,266 | $6,250 | $15,016 |
Source: Public Records
Map
Nearby Homes
- 1759 N Campbell Ave Unit 1
- 2520 W Bloomingdale Ave Unit B
- 1702 N Campbell Ave
- 1718 N Artesian Ave
- 1655 N Campbell Ave Unit 1
- 2451 W Cortland St Unit 3
- 1751 N Western Ave Unit P1
- 1619 N Artesian Ave
- 1714 N Talman Ave Unit 1S
- 1700 N Talman Ave Unit 1
- 2340 W Moffat St
- 1640 N Talman Ave
- 2310 W Saint Paul Ave Unit PB-4A
- 2300 W Bloomingdale Ave Unit P-3
- 2300 W Bloomingdale Ave Unit P-4
- 1541 N Maplewood Ave
- 1533 N Campbell Ave Unit 3
- 1533 N Campbell Ave Unit 2
- 2443 W Armitage Ave Unit PARKING
- 1555 N Talman Ave Unit 3F
- 1722 N Campbell Ave Unit 1
- 1728 N Campbell Ave Unit 2
- 1728 N Campbell Ave
- 1728 N Campbell Ave
- 1728 N Campbell Ave Unit 1
- 1720 N Campbell Ave
- 1730 N Campbell Ave
- 1720 N Campbell Ave
- 1720 N Campbell Ave
- 1732 N Campbell Ave
- 1718 N Campbell Ave
- 1718 N Campbell Ave Unit G
- 1718 N Campbell Ave Unit Garden
- 1718 N Campbell Ave
- 1718 N Campbell Ave Unit 2
- 1716 N Campbell Ave Unit 2
- 1716 N Campbell Ave Unit 1
- 1716 N Campbell Ave
- 1716 N Campbell Ave Unit CH
- 1716 N Campbell Ave Unit G