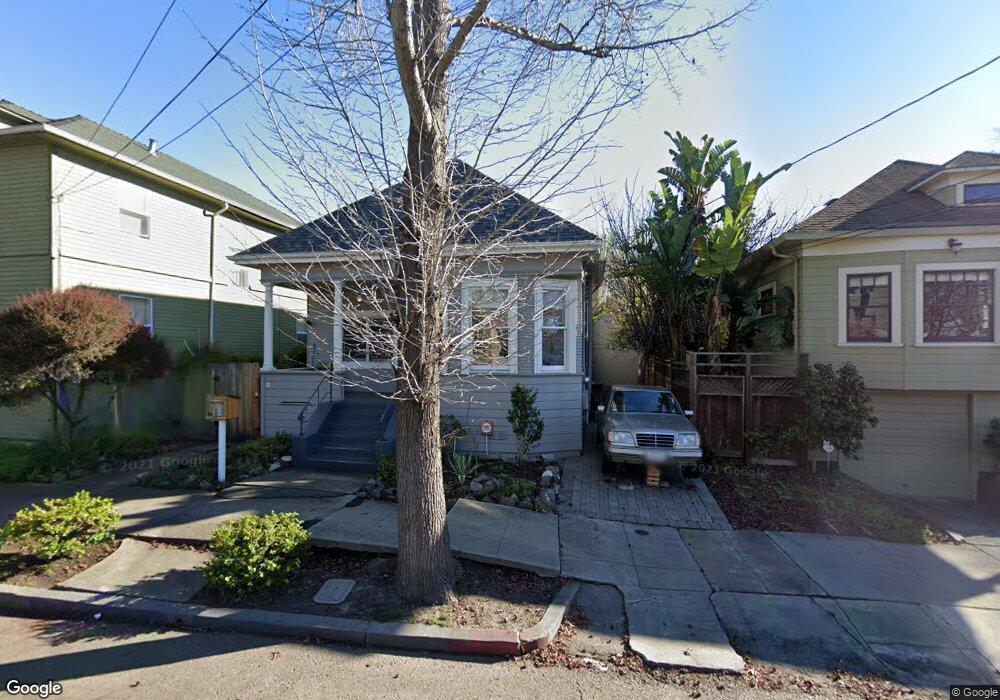
1726 Prince St Berkeley, CA 94703
South Berkeley NeighborhoodEstimated Value: $859,000 - $1,260,000
2
Beds
2
Baths
1,078
Sq Ft
$912/Sq Ft
Est. Value
About This Home
This home is located at 1726 Prince St, Berkeley, CA 94703 and is currently estimated at $983,395, approximately $912 per square foot. 1726 Prince St is a home located in Alameda County with nearby schools including Malcolm X Elementary School, Emerson Elementary School, and John Muir Elementary School.
Ownership History
Date
Name
Owned For
Owner Type
Purchase Details
Closed on
Aug 9, 2010
Sold by
Pyun Catherine Kim
Bought by
Pyun Catherine K and The Catherine K Pyun Living Tr
Current Estimated Value
Home Financials for this Owner
Home Financials are based on the most recent Mortgage that was taken out on this home.
Original Mortgage
$219,000
Interest Rate
4.52%
Mortgage Type
New Conventional
Purchase Details
Closed on
Apr 13, 2008
Sold by
Pyun Catherine K
Bought by
Pyun Catherine K and The Catherine K Pyun Living Tr
Purchase Details
Closed on
Jan 26, 2000
Sold by
Fong Chun W & Tang Mei S Revocable Trust and Chun Wah
Bought by
Pyun Catherine K
Home Financials for this Owner
Home Financials are based on the most recent Mortgage that was taken out on this home.
Original Mortgage
$202,500
Interest Rate
7.87%
Purchase Details
Closed on
Jan 4, 1994
Sold by
Fong Chun Wah and Tang Mei Sim Fong
Bought by
Fong Chun Wah and Tang Mei Sim Fong
Create a Home Valuation Report for This Property
The Home Valuation Report is an in-depth analysis detailing your home's value as well as a comparison with similar homes in the area
Home Values in the Area
Average Home Value in this Area
Purchase History
| Date | Buyer | Sale Price | Title Company |
|---|---|---|---|
| Pyun Catherine K | -- | Old Republic Title Company | |
| Pyun Catherine Kim | -- | Old Republic Title Company | |
| Pyun Catherine K | -- | None Available | |
| Pyun Catherine K | $225,000 | New Century Title Company | |
| Fong Chun Wah | -- | -- |
Source: Public Records
Mortgage History
| Date | Status | Borrower | Loan Amount |
|---|---|---|---|
| Closed | Pyun Catherine Kim | $219,000 | |
| Closed | Pyun Catherine K | $202,500 |
Source: Public Records
Tax History
| Year | Tax Paid | Tax Assessment Tax Assessment Total Assessment is a certain percentage of the fair market value that is determined by local assessors to be the total taxable value of land and additions on the property. | Land | Improvement |
|---|---|---|---|---|
| 2025 | $6,339 | $345,800 | $103,740 | $242,060 |
| 2024 | $6,339 | $339,020 | $101,706 | $237,314 |
| 2023 | $6,196 | $332,374 | $99,712 | $232,662 |
| 2022 | $6,062 | $325,857 | $97,757 | $228,100 |
| 2021 | $6,059 | $319,470 | $95,841 | $223,629 |
| 2020 | $5,687 | $316,196 | $94,859 | $221,337 |
| 2019 | $5,410 | $309,997 | $92,999 | $216,998 |
| 2018 | $5,220 | $303,920 | $91,176 | $212,744 |
| 2017 | $5,019 | $297,962 | $89,388 | $208,574 |
| 2016 | $4,815 | $292,121 | $87,636 | $204,485 |
| 2015 | $4,744 | $287,734 | $86,320 | $201,414 |
| 2014 | $4,695 | $282,097 | $84,629 | $197,468 |
Source: Public Records
Map
Nearby Homes
- 1646 Ashby Ave
- 3110 California St
- 3114 California St
- 2926 Ellis St
- 3138 California St
- 3233 Ellis St
- 3214 California St
- 3101 Sacramento St
- 1507 Prince St
- 1535 Julia St
- 3224 Sacramento St
- 2057 Emerson St
- 2922 Stanton St
- 6555 Shattuck Ave
- 1530 Stuart St
- 6015 Adeline St
- 2124 Prince St
- 737 61st St
- 2110 Ashby Ave
- 968 62nd St
- 1724 Prince St
- 1730 Prince St
- 3107 King St
- 3103 King St
- 3110 Ellis St
- 3104 Ellis St
- 3100 Ellis St
- 3109 King St
- 3112B Ellis St
- 3112 Ellis St Unit A
- 3112A Ellis St
- 3112 Ellis St Unit U1
- 3112 Ellis St Unit U2
- 3125 King St
- 3114 Ellis St
- 3116 Ellis St Unit C
- 3116 Ellis St Unit B
- 3116 Ellis St Unit A
- 1709 Woolsey St
- 1707 Woolsey St
Your Personal Tour Guide
Ask me questions while you tour the home.