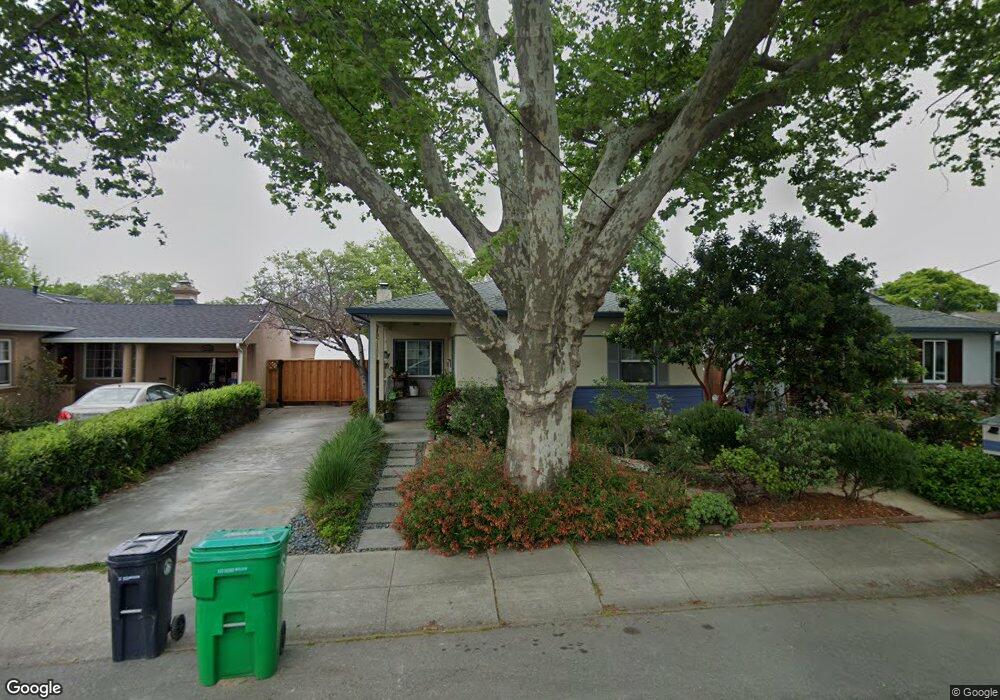
17262 Via Anacapa San Lorenzo, CA 94580
Estimated Value: $824,000 - $904,126
4
Beds
2
Baths
1,600
Sq Ft
$546/Sq Ft
Est. Value
About This Home
This home is located at 17262 Via Anacapa, San Lorenzo, CA 94580 and is currently estimated at $873,782, approximately $546 per square foot. 17262 Via Anacapa is a home located in Alameda County with nearby schools including Lorenzo Manor Elementary School, Bohannon Middle School, and San Lorenzo High School.
Ownership History
Date
Name
Owned For
Owner Type
Purchase Details
Closed on
Dec 10, 2020
Sold by
Capilitan Jesse Lee Java and Vrcek Laura
Bought by
Capilitan Jesse Lee Java and Capilitan Laura Vrcek
Current Estimated Value
Home Financials for this Owner
Home Financials are based on the most recent Mortgage that was taken out on this home.
Original Mortgage
$404,000
Outstanding Balance
$346,635
Interest Rate
2.7%
Mortgage Type
New Conventional
Estimated Equity
$527,147
Purchase Details
Closed on
Jul 5, 2016
Sold by
Gomes Joseph Karl and Gomes Hilda C
Bought by
Capilitan Jesse Lee Java and Vrcek Laura
Home Financials for this Owner
Home Financials are based on the most recent Mortgage that was taken out on this home.
Original Mortgage
$436,800
Interest Rate
3.12%
Mortgage Type
Adjustable Rate Mortgage/ARM
Create a Home Valuation Report for This Property
The Home Valuation Report is an in-depth analysis detailing your home's value as well as a comparison with similar homes in the area
Home Values in the Area
Average Home Value in this Area
Purchase History
| Date | Buyer | Sale Price | Title Company |
|---|---|---|---|
| Capilitan Jesse Lee Java | -- | Old Republic Title Company | |
| Capilitan Jesse Lee Java | $546,000 | First American Title Company |
Source: Public Records
Mortgage History
| Date | Status | Borrower | Loan Amount |
|---|---|---|---|
| Open | Capilitan Jesse Lee Java | $404,000 | |
| Closed | Capilitan Jesse Lee Java | $436,800 |
Source: Public Records
Tax History Compared to Growth
Tax History
| Year | Tax Paid | Tax Assessment Tax Assessment Total Assessment is a certain percentage of the fair market value that is determined by local assessors to be the total taxable value of land and additions on the property. | Land | Improvement |
|---|---|---|---|---|
| 2025 | $8,087 | $626,664 | $192,652 | $441,012 |
| 2024 | $8,087 | $614,243 | $188,876 | $432,367 |
| 2023 | $8,043 | $609,063 | $185,173 | $423,890 |
| 2022 | $7,928 | $590,121 | $181,542 | $415,579 |
| 2021 | $7,712 | $578,415 | $177,983 | $407,432 |
| 2020 | $7,550 | $579,415 | $176,159 | $403,256 |
| 2019 | $7,564 | $568,058 | $172,706 | $395,352 |
| 2018 | $7,163 | $556,920 | $169,320 | $387,600 |
| 2017 | $6,834 | $546,000 | $166,000 | $380,000 |
| 2016 | $1,542 | $89,634 | $31,067 | $58,567 |
| 2015 | $1,505 | $88,287 | $30,600 | $57,687 |
| 2014 | $1,484 | $86,558 | $30,001 | $56,557 |
Source: Public Records
Map
Nearby Homes
- 15958 Via Descanso
- 17761 Via Arriba
- 334 Oxford St
- 17779 Rainier Ave
- 17347 Via Encinas
- 19461 Royal Ave
- 17316 Via Flores
- 15867 Hesperian Blvd
- 19665 Royal Ave
- 819 Bockman Rd
- 17754 Meekland Ave Unit 1
- 19150 Hesperian Blvd Unit 19
- 18251 Via Jose
- 19539 Meekland Ave
- 16011 Via Conejo
- 179 Loma Verde Dr
- 769 Bartlett Ave
- 181 E Lewelling Blvd
- 16050 Via Olinda
- 18905 Standish Ave
- 17234 Via Anacapa
- 17336 Via Anacapa
- 17364 Via Anacapa
- 17160 Via Anacapa
- 17265 Via Segundo
- 17349 Via Segundo
- 17233 Via Segundo
- 17347 Via Segundo
- 17437 Via Segundo
- 17438 Via Anacapa
- 17132 Via Anacapa
- 17235 Via Anacapa
- 17197 Via Segundo
- 17263 Via Anacapa
- 17161 Via Anacapa
- 17337 Via Anacapa
- 17471 Via Segundo
- 253 Via Pecoro
- 17133 Via Anacapa
- 17165 Via Segundo