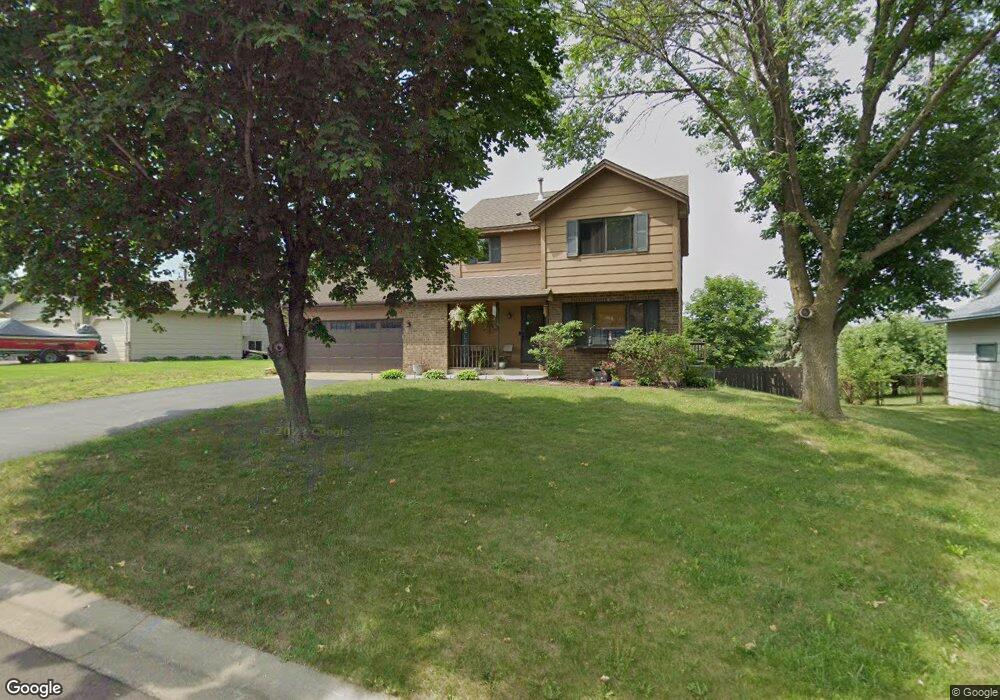
17265 Foliage Ave Farmington, MN 55024
Estimated Value: $389,000 - $435,000
3
Beds
3
Baths
1,368
Sq Ft
$299/Sq Ft
Est. Value
About This Home
This home is located at 17265 Foliage Ave, Farmington, MN 55024 and is currently estimated at $408,706, approximately $298 per square foot. 17265 Foliage Ave is a home located in Dakota County with nearby schools including North Trail Elementary School, Levi P. Dodge Middle School, and Farmington High School.
Ownership History
Date
Name
Owned For
Owner Type
Purchase Details
Closed on
Jul 23, 2017
Sold by
Wyman Peter and Wyman Heather
Bought by
Beedle Stephanie and Fredrickson Elisabet
Current Estimated Value
Home Financials for this Owner
Home Financials are based on the most recent Mortgage that was taken out on this home.
Original Mortgage
$271,503
Outstanding Balance
$225,697
Interest Rate
3.91%
Mortgage Type
New Conventional
Estimated Equity
$183,009
Purchase Details
Closed on
Sep 28, 2007
Sold by
Froemke Mark and Fossey Robyn L
Bought by
Wyman Peter and Wyman Heather
Purchase Details
Closed on
Jun 9, 2004
Sold by
Grapentine James E and Grapentine Tina L
Bought by
Froemke Mark
Purchase Details
Closed on
Mar 31, 1999
Sold by
Nawrocki Michael and Nawrocki Lori
Bought by
Grapentine James E and Grapentine Tina L
Create a Home Valuation Report for This Property
The Home Valuation Report is an in-depth analysis detailing your home's value as well as a comparison with similar homes in the area
Home Values in the Area
Average Home Value in this Area
Purchase History
| Date | Buyer | Sale Price | Title Company |
|---|---|---|---|
| Beedle Stephanie | $279,900 | Trademark Title Services Inc | |
| Wyman Peter | $249,000 | -- | |
| Froemke Mark | $242,000 | -- | |
| Grapentine James E | $145,000 | -- |
Source: Public Records
Mortgage History
| Date | Status | Borrower | Loan Amount |
|---|---|---|---|
| Open | Beedle Stephanie | $271,503 |
Source: Public Records
Tax History Compared to Growth
Tax History
| Year | Tax Paid | Tax Assessment Tax Assessment Total Assessment is a certain percentage of the fair market value that is determined by local assessors to be the total taxable value of land and additions on the property. | Land | Improvement |
|---|---|---|---|---|
| 2024 | $4,362 | $348,800 | $83,900 | $264,900 |
| 2023 | $4,362 | $357,700 | $83,600 | $274,100 |
| 2022 | $3,482 | $340,800 | $83,300 | $257,500 |
| 2021 | $3,178 | $286,400 | $72,500 | $213,900 |
| 2020 | $3,260 | $256,500 | $72,400 | $184,100 |
| 2019 | $3,099 | $254,300 | $69,000 | $185,300 |
| 2018 | $3,003 | $241,900 | $65,700 | $176,200 |
| 2017 | $2,973 | $0 | $0 | $0 |
| 2016 | $3,017 | $222,600 | $59,500 | $163,100 |
| 2015 | $2,737 | $200,271 | $53,124 | $147,147 |
| 2014 | -- | $195,911 | $51,474 | $144,437 |
| 2013 | -- | $178,144 | $46,429 | $131,715 |
Source: Public Records
Map
Nearby Homes
- 6882 173rd St W
- 17583 Foxboro Ln
- 17126 Firtree Place
- 17415 Fireside Ln
- 17408 Gettysburg Way Unit 24184
- 17698 Fortune Trail
- 17830 Glasgow Way
- 6649 167th St W
- 6678 166th St W
- 7130 167th Ct W
- 17891 Glasgow Way
- 17867 Flint Ave
- 16660 Garland Way W
- 17896 Glasgow Way
- 17937 Genoa Dr
- 17935 Genoa Dr
- 16546 Foliage Ave W
- 17935 Giants Way
- Ashton Plan at Cordelia - Freedom
- Hadley Plan at Cordelia - Freedom
- 17255 Foliage Ave
- 17285 Foliage Ave
- 6671 Folsom Path
- 17305 Foliage Ave
- 17245 Foliage Ave
- 17305 17305 Foliage-Avenue-
- 17305 17305 Foliage Ave
- 17260 Foliage Ave
- 6683 6683 Folsom Path
- 17280 Foliage Ave
- 17280 17280 Foliage Ave
- 6683 Folsom Path
- 17225 Foliage Ave
- 17300 Foliage Ave
- 17230 17230 Foliage Ave
- 17230 Foliage Ave
- 6640 173rd St W
- 6697 Folsom Path
- 17325 Foliage Ave
- 17325 17325 Foliage Ave