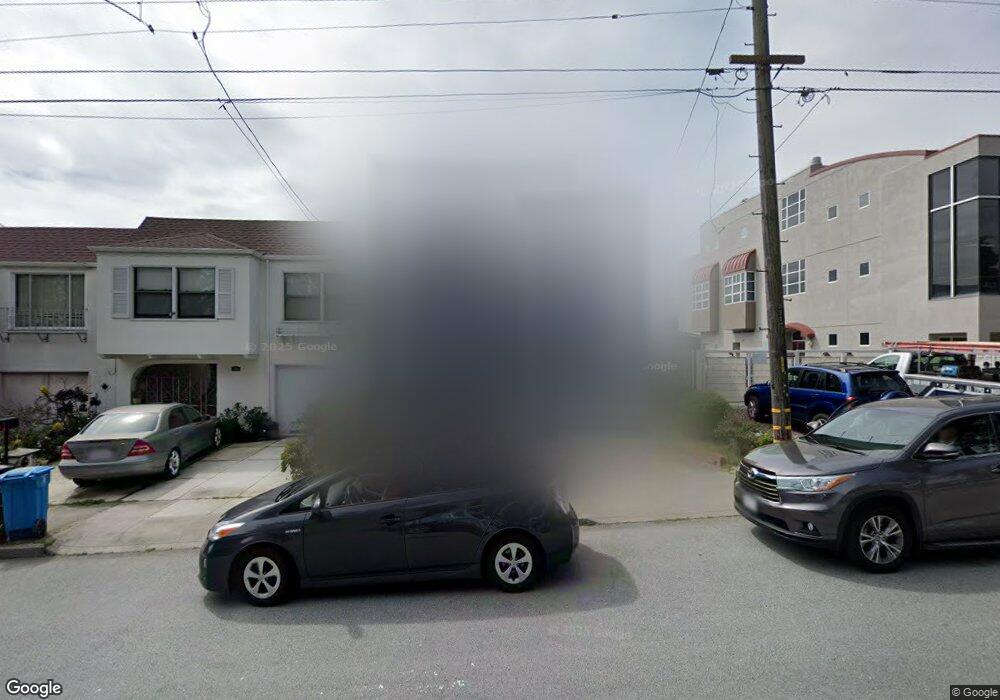
1727 37th Ave San Francisco, CA 94122
Outer Sunset NeighborhoodEstimated Value: $1,762,000 - $2,051,000
3
Beds
3
Baths
2,230
Sq Ft
$836/Sq Ft
Est. Value
About This Home
This home is located at 1727 37th Ave, San Francisco, CA 94122 and is currently estimated at $1,863,764, approximately $835 per square foot. 1727 37th Ave is a home located in San Francisco County with nearby schools including Key (Francis Scott) Elementary School, Giannini (A.P.) Middle School, and Holy Name Elementary School.
Ownership History
Date
Name
Owned For
Owner Type
Purchase Details
Closed on
Jul 19, 1995
Sold by
Wong Kathleen C
Bought by
Wong Kathleen C and Woo David C
Current Estimated Value
Home Financials for this Owner
Home Financials are based on the most recent Mortgage that was taken out on this home.
Original Mortgage
$58,000
Interest Rate
7.61%
Purchase Details
Closed on
Jul 18, 1995
Sold by
Sung Victor K
Bought by
Wong Kathleen C and Sung Kathleen C
Home Financials for this Owner
Home Financials are based on the most recent Mortgage that was taken out on this home.
Original Mortgage
$58,000
Interest Rate
7.61%
Create a Home Valuation Report for This Property
The Home Valuation Report is an in-depth analysis detailing your home's value as well as a comparison with similar homes in the area
Home Values in the Area
Average Home Value in this Area
Purchase History
| Date | Buyer | Sale Price | Title Company |
|---|---|---|---|
| Wong Kathleen C | -- | Fidelity National Title Co | |
| Wong Kathleen C | -- | Fidelity National Title Co |
Source: Public Records
Mortgage History
| Date | Status | Borrower | Loan Amount |
|---|---|---|---|
| Closed | Wong Kathleen C | $58,000 |
Source: Public Records
Tax History
| Year | Tax Paid | Tax Assessment Tax Assessment Total Assessment is a certain percentage of the fair market value that is determined by local assessors to be the total taxable value of land and additions on the property. | Land | Improvement |
|---|---|---|---|---|
| 2025 | $5,079 | $439,727 | $145,007 | $294,720 |
| 2024 | $5,079 | $431,106 | $142,164 | $288,942 |
| 2023 | $5,006 | $422,654 | $139,377 | $283,277 |
| 2022 | $4,917 | $414,368 | $136,645 | $277,723 |
| 2021 | $4,832 | $406,244 | $133,966 | $272,278 |
| 2020 | $5,475 | $402,080 | $132,593 | $269,487 |
| 2019 | $5,290 | $394,197 | $129,994 | $264,203 |
| 2018 | $5,112 | $386,469 | $127,446 | $259,023 |
| 2017 | $4,752 | $378,893 | $124,948 | $253,945 |
| 2016 | $4,650 | $371,465 | $122,499 | $248,966 |
| 2015 | $4,589 | $365,886 | $120,659 | $245,227 |
| 2014 | $4,468 | $358,720 | $118,296 | $240,424 |
Source: Public Records
Map
Nearby Homes
- 1801 38th Ave
- 2830 Lawton St
- 2501 Moraga St
- 1575 43rd Ave
- 1846 31st Ave
- 1371 34th Ave
- 1352 34th Ave
- 2100 34th Ave
- 3327 Quintara St
- 1954 29th Ave
- 2126 43rd Ave
- 2422 Pacheco St
- 1547 47th Ave
- 2210 39th Ave
- 1483 47th Ave
- 1738 Great Hwy
- 2082 46th Ave
- 3427 Lincoln Way Unit 3429
- 1354 29th Ave
- 1364-1368 47th Ave
Your Personal Tour Guide
Ask me questions while you tour the home.