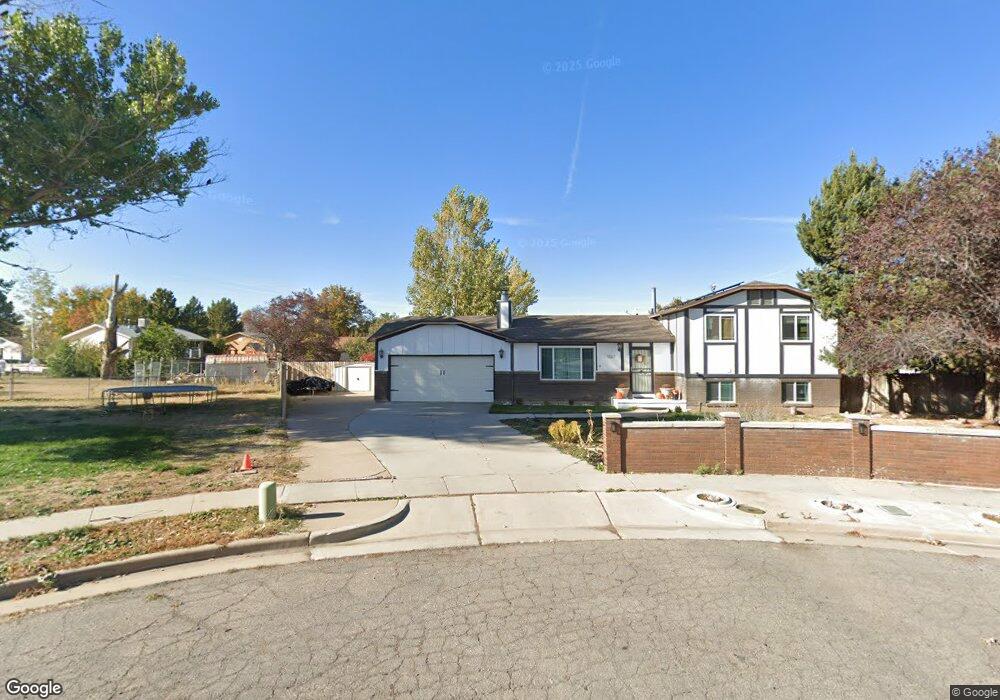
1727 N 2700 W Clearfield, UT 84015
Estimated Value: $459,000 - $495,000
4
Beds
3
Baths
2,106
Sq Ft
$226/Sq Ft
Est. Value
About This Home
This home is located at 1727 N 2700 W, Clearfield, UT 84015 and is currently estimated at $476,322, approximately $226 per square foot. 1727 N 2700 W is a home located in Davis County with nearby schools including West Clinton Elementary School, West Point Junior High School, and Syracuse High School.
Ownership History
Date
Name
Owned For
Owner Type
Purchase Details
Closed on
Apr 1, 2020
Sold by
Goble Carmen
Bought by
Hawkes Brennen and Hawkes Valeria
Current Estimated Value
Home Financials for this Owner
Home Financials are based on the most recent Mortgage that was taken out on this home.
Original Mortgage
$315,250
Outstanding Balance
$278,666
Interest Rate
3.4%
Mortgage Type
New Conventional
Estimated Equity
$197,656
Purchase Details
Closed on
May 30, 2017
Sold by
Kelley Christopher L
Bought by
Goble Carmen
Home Financials for this Owner
Home Financials are based on the most recent Mortgage that was taken out on this home.
Original Mortgage
$163,000
Interest Rate
4.02%
Mortgage Type
New Conventional
Purchase Details
Closed on
Apr 5, 2002
Sold by
Gehrlein Joseph John and Gehrlein Marcia A
Bought by
Kelley Christopher L
Home Financials for this Owner
Home Financials are based on the most recent Mortgage that was taken out on this home.
Original Mortgage
$133,898
Interest Rate
6.78%
Mortgage Type
FHA
Create a Home Valuation Report for This Property
The Home Valuation Report is an in-depth analysis detailing your home's value as well as a comparison with similar homes in the area
Home Values in the Area
Average Home Value in this Area
Purchase History
| Date | Buyer | Sale Price | Title Company |
|---|---|---|---|
| Hawkes Brennen | -- | Us Title Company Of Utah | |
| Goble Carmen | -- | Metro National Title | |
| Kelley Christopher L | -- | Security Title Company |
Source: Public Records
Mortgage History
| Date | Status | Borrower | Loan Amount |
|---|---|---|---|
| Open | Hawkes Brennen | $315,250 | |
| Previous Owner | Goble Carmen | $163,000 | |
| Previous Owner | Kelley Christopher L | $133,898 |
Source: Public Records
Tax History Compared to Growth
Tax History
| Year | Tax Paid | Tax Assessment Tax Assessment Total Assessment is a certain percentage of the fair market value that is determined by local assessors to be the total taxable value of land and additions on the property. | Land | Improvement |
|---|---|---|---|---|
| 2025 | $2,603 | $250,250 | $98,503 | $151,747 |
| 2024 | $2,504 | $242,000 | $107,895 | $134,105 |
| 2023 | $2,276 | $407,000 | $123,424 | $283,576 |
| 2022 | $2,441 | $241,450 | $74,687 | $166,763 |
| 2021 | $2,214 | $325,000 | $94,874 | $230,126 |
| 2020 | $1,900 | $276,000 | $81,351 | $194,649 |
| 2019 | $1,818 | $258,000 | $93,705 | $164,295 |
| 2018 | $1,621 | $226,000 | $78,971 | $147,029 |
| 2016 | $1,452 | $104,556 | $30,905 | $73,651 |
| 2015 | $1,350 | $92,401 | $30,905 | $61,496 |
| 2014 | $1,190 | $82,757 | $30,905 | $51,852 |
| 2013 | -- | $79,583 | $25,230 | $54,353 |
Source: Public Records
Map
Nearby Homes
- 1648 N 2615 W
- 3941 W 1800 N
- 1509 N 2475 W
- 2647 W 1445 N
- 2617 N 2080 W Unit 176
- 1449 N 2475 W
- 1458 N 2400 W
- 2259 W 1800 N
- 2921 W 1300 N
- Harvard Plan at Summerfield - Enclave
- 2208 W 2615 N
- Linden Plan at Summerfield - Vista
- Yale Plan at Summerfield - Enclave
- Gambel Oak Plan at Summerfield - Vista
- Cedar Plan at Summerfield - Vista
- Elm Plan at Summerfield - Vista
- Princeton Plan at Summerfield - Enclave
- Cambridge Plan at Summerfield - Enclave
- Cornell Plan at Summerfield - Enclave
- Sycamore Plan at Summerfield - Vista