
Seller's Agent in 2019
Jane Lee
RE/MAX
(847) 420-8866
122 in this area
2,348 Total Sales
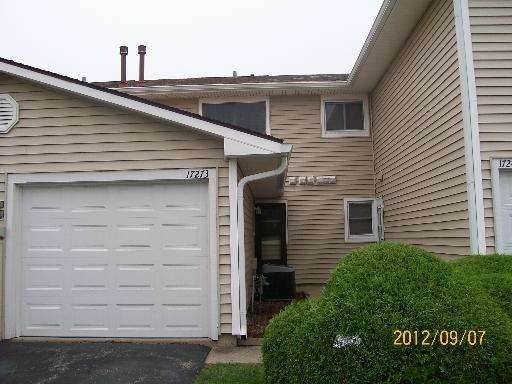
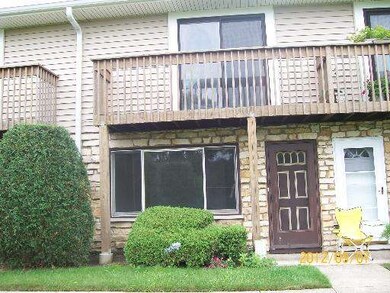


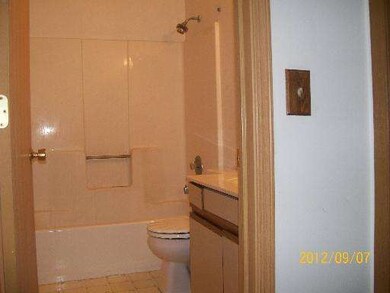
COUNTRY LIVING BEST DESCRIBES THIS TOWNHOUSE WITH NICE VIEWS OF THE COUNTRYSIDE WHICH HAS A LOT OF OPEN SPACES & TREES. IT IS LOCATED IN A QUIET CORNER OF WOODLAND HILLS SUB. OFFERING TENNIS COURTS, WALKING TRAILS & PLAYGROUND! SOLD AS IS, 100% TAX PRORATIONS, NO SURVEY, PRE QUAL LETTER, EM MUST BE CERTIFIED FUNDS, ADDENDUMS ON MLSNI. THIS PROPERTY IS ELIGIBLE UNDER THE FREDDIE MAC FIRST LOOK INITIATIVE THRU 9/21/12.
Last Agent to Sell the Property
Netgar Investments Inc License #475141891 Listed on: 09/05/2012
Last Buyer's Agent
Jane Lee
RE/MAX Top Performers
Home Type
Est. Annual Taxes
Year Built
Lot Details
HOA Fees
Parking
Home Design
Kitchen
Laundry
Outdoor Features
Utilities
Amenities
Pet Policy
| Date | Type | Sale Price | Title Company |
|---|---|---|---|
| Warranty Deed | $140,000 | Landtrust National Ttl Svcs | |
| Quit Claim Deed | -- | Attorney | |
| Special Warranty Deed | $45,000 | Attorneys Title Guaranty Fun | |
| Sheriffs Deed | -- | None Available | |
| Interfamily Deed Transfer | -- | Chicago Title Insurance Co | |
| Warranty Deed | $89,000 | -- |
| Date | Status | Loan Amount | Loan Type |
|---|---|---|---|
| Open | $140,142 | VA | |
| Closed | $143,010 | VA | |
| Previous Owner | $125,350 | Fannie Mae Freddie Mac | |
| Previous Owner | $13,400 | Unknown | |
| Previous Owner | $101,600 | Unknown | |
| Previous Owner | $100,000 | Unknown | |
| Previous Owner | $85,000 | No Value Available | |
| Previous Owner | $86,200 | No Value Available | |
| Closed | $10,050 | No Value Available |
| Date | Event | Price | Change | Sq Ft Price |
|---|---|---|---|---|
| 11/18/2019 11/18/19 | Sold | $140,000 | 0.0% | $133 / Sq Ft |
| 10/29/2019 10/29/19 | Pending | -- | -- | -- |
| 10/23/2019 10/23/19 | For Sale | $140,000 | +211.1% | $133 / Sq Ft |
| 05/02/2013 05/02/13 | Sold | $45,000 | -6.4% | $43 / Sq Ft |
| 04/12/2013 04/12/13 | Pending | -- | -- | -- |
| 03/27/2013 03/27/13 | For Sale | $48,100 | +6.9% | $46 / Sq Ft |
| 03/07/2013 03/07/13 | Off Market | $45,000 | -- | -- |
| 02/28/2013 02/28/13 | For Sale | $48,100 | 0.0% | $46 / Sq Ft |
| 01/31/2013 01/31/13 | Pending | -- | -- | -- |
| 01/09/2013 01/09/13 | For Sale | $48,100 | 0.0% | $46 / Sq Ft |
| 01/02/2013 01/02/13 | Pending | -- | -- | -- |
| 12/26/2012 12/26/12 | For Sale | $48,100 | 0.0% | $46 / Sq Ft |
| 10/03/2012 10/03/12 | Pending | -- | -- | -- |
| 09/24/2012 09/24/12 | For Sale | $48,100 | 0.0% | $46 / Sq Ft |
| 09/19/2012 09/19/12 | Pending | -- | -- | -- |
| 09/05/2012 09/05/12 | For Sale | $48,100 | -- | $46 / Sq Ft |
| Year | Tax Paid | Tax Assessment Tax Assessment Total Assessment is a certain percentage of the fair market value that is determined by local assessors to be the total taxable value of land and additions on the property. | Land | Improvement |
|---|---|---|---|---|
| 2024 | $3,498 | $52,718 | $6,574 | $46,144 |
| 2023 | $3,463 | $44,845 | $5,592 | $39,253 |
| 2022 | $3,463 | $40,881 | $5,593 | $35,288 |
| 2021 | $3,118 | $39,241 | $5,369 | $33,872 |
| 2020 | $2,990 | $38,276 | $5,237 | $33,039 |
| 2019 | $3,482 | $37,165 | $5,085 | $32,080 |
| 2018 | $2,125 | $23,275 | $3,279 | $19,996 |
| 2017 | $2,132 | $22,608 | $3,185 | $19,423 |
| 2016 | $2,131 | $21,601 | $3,043 | $18,558 |
| 2015 | $1,471 | $20,487 | $2,886 | $17,601 |
| 2014 | $2,561 | $29,609 | $2,847 | $26,762 |
| 2012 | $2,274 | $29,836 | $2,869 | $26,967 |
Seller's Agent in 2019
Jane Lee
RE/MAX
(847) 420-8866
122 in this area
2,348 Total Sales
Buyer's Agent in 2019
Mike Nielsen
RE/MAX
(847) 276-0199
7 in this area
185 Total Sales
Seller's Agent in 2013
Beverly Peterson
Netgar Investments Inc
(847) 772-7322
2 Total Sales
Source: Midwest Real Estate Data (MRED)
MLS Number: MRD08154461
APN: 07-20-400-076
Disclaimer: Certain information contained herein is derived from information provided by parties other than Homes.com. All information provided is deemed reliable, but is not guaranteed to be accurate and should be independently verified.
![]() Based on information submitted to the MLS GRID. All data is obtained from various sources and may not have been verified by broker or MLS GRID. Supplied Open House Information is subject to change without notice. All information should be independently reviewed and verified for accuracy. Properties may or may not be listed by the office/agent presenting the information. Some IDX listings have been excluded from this website.
Based on information submitted to the MLS GRID. All data is obtained from various sources and may not have been verified by broker or MLS GRID. Supplied Open House Information is subject to change without notice. All information should be independently reviewed and verified for accuracy. Properties may or may not be listed by the office/agent presenting the information. Some IDX listings have been excluded from this website.
The Digital Millennium Copyright Act of 1998, 17 U.S.C. § 512 (the “DMCA”) provides recourse for copyright owners who believe that material appearing on the Internet infringes their rights under U.S. copyright law. If you believe in good faith that any content or material made available in connection with our website or services infringes your copyright, you (or your agent) may send us a notice requesting that the content or material be removed, or access to it blocked.
Notices must be sent in writing by email to DMCAnotice@MLSGrid.com.
The DMCA requires that your notice of alleged copyright infringement include the following information:
(1) description of the copyrighted work that is the subject of claimed infringement;
(2) description of the alleged infringing content and information sufficient to permit us to locate the content;
(3) contact information for you, including your address, telephone number and email address;
(4) a statement by you that you have a good faith belief that the content in the manner complained of is not authorized by the copyright owner, or its agent, or by the operation of any law;
(5) a statement by you, signed under penalty of perjury, that the information in the notification is accurate and that you have the authority to enforce the copyrights that are claimed to be infringed; and
(6) a physical or electronic signature of the copyright owner or a person authorized to act on the copyright owner’s behalf. Failure to include all of the above information may result in the delay of the processing of your complaint.