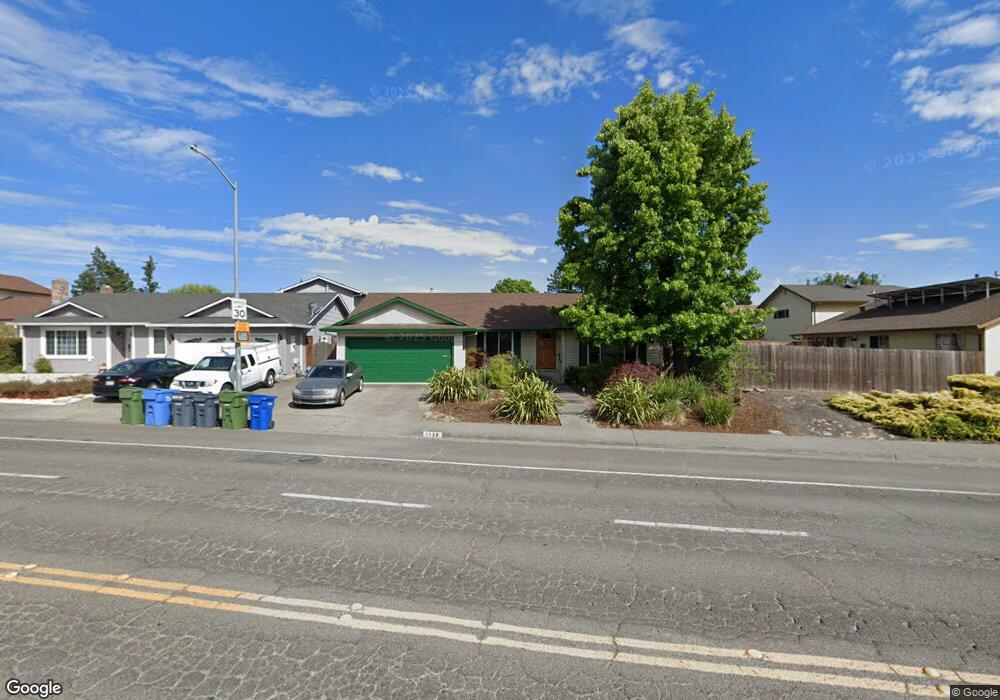
1728 Caulfield Ln Petaluma, CA 94954
Adobe NeighborhoodEstimated Value: $808,600 - $921,000
4
Beds
2
Baths
1,748
Sq Ft
$487/Sq Ft
Est. Value
About This Home
This home is located at 1728 Caulfield Ln, Petaluma, CA 94954 and is currently estimated at $851,400, approximately $487 per square foot. 1728 Caulfield Ln is a home located in Sonoma County with nearby schools including La Tercera Elementary School, Kenilworth Junior High School, and Casa Grande High School.
Ownership History
Date
Name
Owned For
Owner Type
Purchase Details
Closed on
Nov 23, 2011
Sold by
Detels Kimberley A and Detels Loren R
Bought by
Detel Loren R and Detels Kimberley A
Current Estimated Value
Home Financials for this Owner
Home Financials are based on the most recent Mortgage that was taken out on this home.
Original Mortgage
$202,500
Outstanding Balance
$20,531
Interest Rate
4.06%
Mortgage Type
New Conventional
Estimated Equity
$830,869
Purchase Details
Closed on
Sep 23, 1998
Sold by
Detels Kimberley A and Casey Kimberly A
Bought by
Detels Loren R and Detels Kimberley A
Home Financials for this Owner
Home Financials are based on the most recent Mortgage that was taken out on this home.
Original Mortgage
$170,000
Interest Rate
6.88%
Purchase Details
Closed on
Jun 20, 1997
Sold by
Hummer Warren L and Hummer Catherine L
Bought by
Casey Kimberley A and Detels Loren R
Home Financials for this Owner
Home Financials are based on the most recent Mortgage that was taken out on this home.
Original Mortgage
$171,500
Interest Rate
7.91%
Create a Home Valuation Report for This Property
The Home Valuation Report is an in-depth analysis detailing your home's value as well as a comparison with similar homes in the area
Home Values in the Area
Average Home Value in this Area
Purchase History
| Date | Buyer | Sale Price | Title Company |
|---|---|---|---|
| Detel Loren R | -- | Old Republic Title Company | |
| Detels Loren R | -- | Pacific Coast Title Company | |
| Casey Kimberley A | $184,500 | North American Title Co |
Source: Public Records
Mortgage History
| Date | Status | Borrower | Loan Amount |
|---|---|---|---|
| Open | Detel Loren R | $202,500 | |
| Closed | Detels Loren R | $170,000 | |
| Closed | Casey Kimberley A | $171,500 |
Source: Public Records
Tax History Compared to Growth
Tax History
| Year | Tax Paid | Tax Assessment Tax Assessment Total Assessment is a certain percentage of the fair market value that is determined by local assessors to be the total taxable value of land and additions on the property. | Land | Improvement |
|---|---|---|---|---|
| 2025 | $3,188 | $294,575 | $127,727 | $166,848 |
| 2024 | $3,188 | $288,800 | $125,223 | $163,577 |
| 2023 | $3,188 | $283,138 | $122,768 | $160,370 |
| 2022 | $3,113 | $277,587 | $120,361 | $157,226 |
| 2021 | $3,075 | $272,145 | $118,001 | $154,144 |
| 2020 | $3,096 | $269,356 | $116,792 | $152,564 |
| 2019 | $3,064 | $264,075 | $114,502 | $149,573 |
| 2018 | $2,974 | $258,898 | $112,257 | $146,641 |
| 2017 | $2,930 | $253,822 | $110,056 | $143,766 |
| 2016 | $2,834 | $248,847 | $107,899 | $140,948 |
| 2015 | $2,760 | $245,110 | $106,279 | $138,831 |
| 2014 | $2,731 | $240,310 | $104,198 | $136,112 |
Source: Public Records
Map
Nearby Homes
- 642 Albert Way
- 1711 Capistrano Dr
- 601 Marylyn Cir Unit 21
- 602 Marylyn Cir
- 724 Garfield Dr
- 827 Grouse Ln
- 1103 Marylyn Cir
- 29 Palomino Ct
- 1627 Juliet Dr
- 2044 Willow Dr
- 1513 Elizabeth Dr
- 2189 Saint Augustine Cir
- 73 Alta Dr
- 1688 Kearny Ct
- 2013 Knight Ave
- 859 S Mcdowell Blvd
- 4 Starling Dr
- 29 Alta Dr
- 1052 Helen Ct
- 1785 Pine Ave
- 1732 Caulfield Ln
- 727 Louise Dr
- 723 Louise Dr
- 1709 Tampico Ct
- 1705 Tampico Ct
- 1736 Caulfield Ln
- 1713 Tampico Ct
- 1701 Tampico Ct
- 1740 Caulfield Ln
- 1717 Tampico Ct
- 1729 Caulfield Ln
- 1733 Caulfield Ln
- 1725 Caulfield Ln
- 1737 Caulfield Ln
- 1721 Caulfield Ln
- 1716 Caulfield Ln
- 1721 Tampico Ct
- 1800 Caulfield Ln
- 728 Louise Dr
- 1708 Tampico Ct