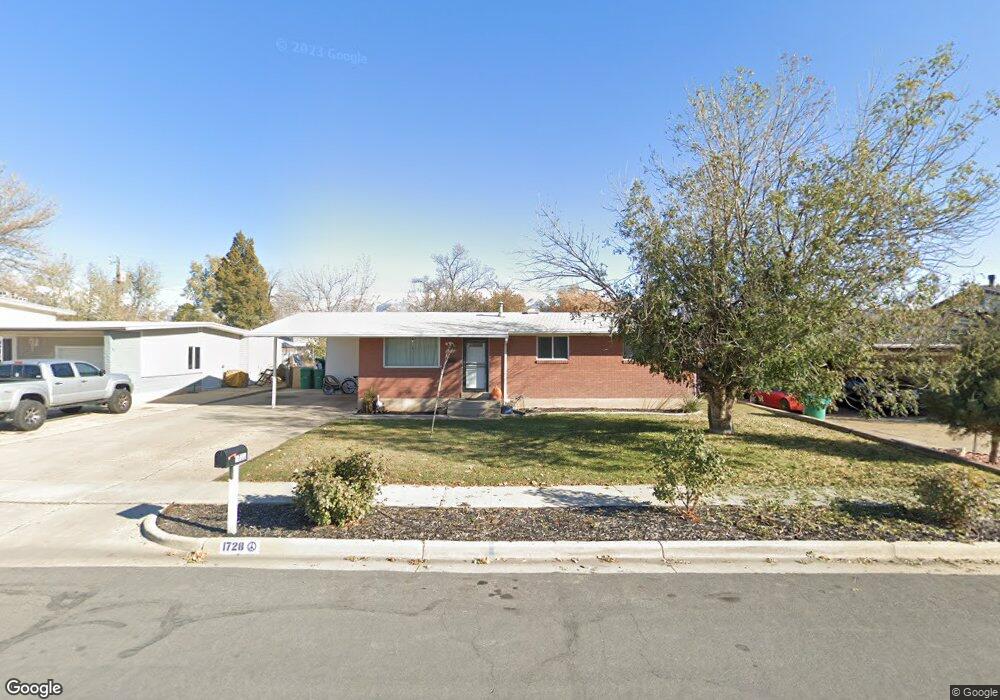
1728 N Afton Cir Layton, UT 84041
Estimated Value: $374,000 - $405,674
3
Beds
2
Baths
2,050
Sq Ft
$188/Sq Ft
Est. Value
About This Home
This home is located at 1728 N Afton Cir, Layton, UT 84041 and is currently estimated at $386,169, approximately $188 per square foot. 1728 N Afton Cir is a home located in Davis County with nearby schools including Vae View Elementary School, Central Davis Junior High School, and Layton High School.
Ownership History
Date
Name
Owned For
Owner Type
Purchase Details
Closed on
Sep 29, 2014
Sold by
Brunson Larry
Bought by
Jones Alicia
Current Estimated Value
Home Financials for this Owner
Home Financials are based on the most recent Mortgage that was taken out on this home.
Original Mortgage
$7,540
Interest Rate
4.07%
Mortgage Type
Stand Alone Second
Purchase Details
Closed on
Jul 7, 2005
Sold by
Hungerford Wayne N
Bought by
Brunson Larry and Brunson Margaret
Home Financials for this Owner
Home Financials are based on the most recent Mortgage that was taken out on this home.
Original Mortgage
$17,000
Interest Rate
5.41%
Mortgage Type
Stand Alone Second
Purchase Details
Closed on
May 26, 2005
Sold by
Hungerford Wayne N
Bought by
Brunson Larry and Brunson Margaret
Home Financials for this Owner
Home Financials are based on the most recent Mortgage that was taken out on this home.
Original Mortgage
$17,000
Interest Rate
5.41%
Mortgage Type
Stand Alone Second
Create a Home Valuation Report for This Property
The Home Valuation Report is an in-depth analysis detailing your home's value as well as a comparison with similar homes in the area
Home Values in the Area
Average Home Value in this Area
Purchase History
| Date | Buyer | Sale Price | Title Company |
|---|---|---|---|
| Jones Alicia | -- | None Available | |
| Brunson Larry | -- | Equity Title Ins Agency Inc | |
| Brunson Larry | -- | Equity Title Ins Agency Inc |
Source: Public Records
Mortgage History
| Date | Status | Borrower | Loan Amount |
|---|---|---|---|
| Open | Jones Alicia | $7,540 | |
| Open | Jones Alicia | $127,645 | |
| Previous Owner | Brunson Larry | $17,000 | |
| Previous Owner | Brunson Larry | $68,000 |
Source: Public Records
Tax History Compared to Growth
Tax History
| Year | Tax Paid | Tax Assessment Tax Assessment Total Assessment is a certain percentage of the fair market value that is determined by local assessors to be the total taxable value of land and additions on the property. | Land | Improvement |
|---|---|---|---|---|
| 2024 | $1,810 | $191,400 | $119,689 | $71,711 |
| 2023 | $1,760 | $328,000 | $158,359 | $169,641 |
| 2022 | $1,902 | $192,500 | $73,674 | $118,826 |
| 2021 | $1,722 | $260,000 | $103,986 | $156,014 |
| 2020 | $1,443 | $209,000 | $76,134 | $132,866 |
| 2019 | $1,438 | $204,000 | $73,208 | $130,792 |
| 2018 | $1,250 | $178,000 | $67,785 | $110,215 |
| 2016 | $1,076 | $79,036 | $19,674 | $59,362 |
| 2015 | $1,029 | $71,776 | $19,674 | $52,102 |
| 2014 | $1,069 | $76,189 | $19,674 | $56,515 |
| 2013 | -- | $71,827 | $19,646 | $52,181 |
Source: Public Records
Map
Nearby Homes
- 1645 N Celia Way
- 1847 John St
- 1949 W 1620 N
- 1937 W 1620 N
- 1596 N Main St Unit 2
- 939 E Sam Cir
- 1501 N Celia Way
- 1430 N 2100 W
- 2114 S 825 E
- 1491 N 1875 W Unit 158
- 1487 N 1875 W Unit 159
- 1476 N 1875 W Unit 164
- 1463 N 1875 W
- 1463 N 1875 W Unit 165
- 1459 N 1875 W
- 1459 N 1875 W Unit 166
- 1459 N 1875 W Unit 167
- 1900 N 1690 W
- 1451 N 1875 W
- 1451 N 1875 W Unit 168
- 1716 N Afton Cir
- 1740 N Afton Cir
- 1741 N Gregory Dr
- 1749 N Gregory Dr
- 1766 N Afton Cir
- 1708 N Afton Cir
- 2004 W Afton Cir
- 2029 Clara St
- 1761 N Gregory Dr
- 1725 N Afton Cir
- 1725 N Gregory Dr
- 1782 N Afton Cir
- 1785 N Gregory Dr
- 1717 N Afton Cir
- 1740 N Gregory Dr
- 2075 Clara St
- 1800 N Afton Cir
- 1783 N Afton Cir
- 1701 N Afton Cir
- 1752 N Mark St