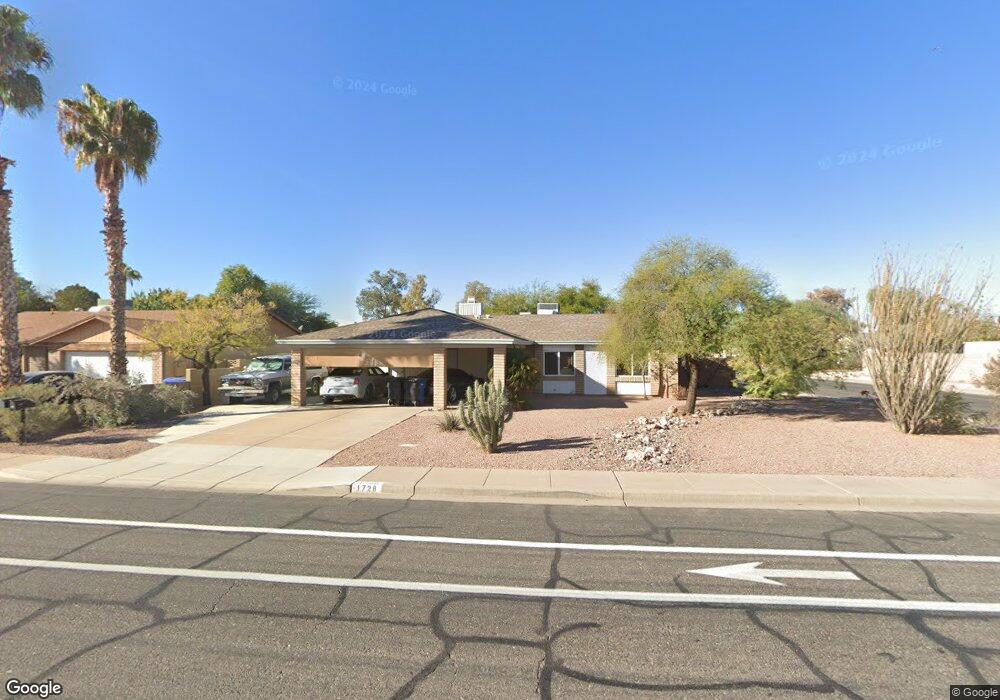
1728 N Bullmoose Dr Chandler, AZ 85224
Central Ridge NeighborhoodEstimated Value: $346,863 - $466,000
--
Bed
2
Baths
1,296
Sq Ft
$317/Sq Ft
Est. Value
About This Home
This home is located at 1728 N Bullmoose Dr, Chandler, AZ 85224 and is currently estimated at $410,216, approximately $316 per square foot. 1728 N Bullmoose Dr is a home located in Maricopa County with nearby schools including Chandler Traditional Academy - Goodman, Andersen Junior High School, and Chandler High School.
Ownership History
Date
Name
Owned For
Owner Type
Purchase Details
Closed on
Mar 24, 2023
Sold by
Hevier Don and Hevier Sally S
Bought by
Ds Hevier Trust
Current Estimated Value
Purchase Details
Closed on
Jan 3, 1997
Sold by
Hevier Donald A and Hevier Sally S
Bought by
Hevier Don and Hevier Sally S
Purchase Details
Closed on
Jan 30, 1995
Sold by
Spearman Linda Anese
Bought by
Hevier Donald A and Hevier Sally S
Home Financials for this Owner
Home Financials are based on the most recent Mortgage that was taken out on this home.
Original Mortgage
$83,900
Interest Rate
9.27%
Mortgage Type
New Conventional
Create a Home Valuation Report for This Property
The Home Valuation Report is an in-depth analysis detailing your home's value as well as a comparison with similar homes in the area
Home Values in the Area
Average Home Value in this Area
Purchase History
| Date | Buyer | Sale Price | Title Company |
|---|---|---|---|
| Ds Hevier Trust | -- | -- | |
| Hevier Don | -- | -- | |
| Hevier Donald A | $86,500 | Security Title Agency |
Source: Public Records
Mortgage History
| Date | Status | Borrower | Loan Amount |
|---|---|---|---|
| Previous Owner | Hevier Donald A | $83,900 |
Source: Public Records
Tax History Compared to Growth
Tax History
| Year | Tax Paid | Tax Assessment Tax Assessment Total Assessment is a certain percentage of the fair market value that is determined by local assessors to be the total taxable value of land and additions on the property. | Land | Improvement |
|---|---|---|---|---|
| 2025 | $1,143 | $14,675 | -- | -- |
| 2024 | $1,104 | $13,976 | -- | -- |
| 2023 | $1,104 | $31,550 | $6,310 | $25,240 |
| 2022 | $1,065 | $23,400 | $4,680 | $18,720 |
| 2021 | $1,117 | $21,700 | $4,340 | $17,360 |
| 2020 | $1,112 | $19,700 | $3,940 | $15,760 |
| 2019 | $1,069 | $17,880 | $3,570 | $14,310 |
| 2018 | $1,035 | $16,100 | $3,220 | $12,880 |
| 2017 | $965 | $14,860 | $2,970 | $11,890 |
| 2016 | $930 | $13,830 | $2,760 | $11,070 |
| 2015 | $901 | $12,360 | $2,470 | $9,890 |
Source: Public Records
Map
Nearby Homes
- 2221 W Rockwell Dr
- 2663 W Estrella Dr
- 2431 W Los Arboles Place
- 2702 W Brooks St
- 2100 W Lemon Tree Place Unit 68
- 2100 W Lemon Tree Place Unit 29
- 2100 W Lemon Tree Place Unit 78
- 1962 N Blackstone Dr
- 2050 N 90th Place
- 2875 W Highland St Unit 1102
- 2875 W Highland St Unit 1112
- 2210 N Los Altos Dr
- 1367 N Los Altos Dr
- 1728 N Cholla St
- 1719 N Cholla St
- 1260 N Salida Del Sol
- 2103 W Palomino Dr
- 1771 W Mariposa Ct
- 2173 E La Vieve Ln
- 2015 N Villas Ln
- 1724 N Bullmoose Dr
- 1804 N Bullmoose Dr
- 2505 W Estrella Dr
- 2413 W Estrella Dr
- 2324 W Highland Ct
- 2328 W Highland Ct
- 2502 W Estrella Dr
- 2332 W Highland Ct
- 1647 N Bullmoose Dr
- 1808 N Bullmoose Dr
- 1803 N Bullmoose Dr
- 2509 W Estrella Dr
- 2409 W Estrella Dr
- 1643 N Bullmoose Dr
- 2506 W Estrella Dr
- 1812 N Bullmoose Dr
- 1807 N Bullmoose Dr
- 2336 W Highland Ct
- 2511 W Stottler Dr
- 1816 N Bullmoose Dr