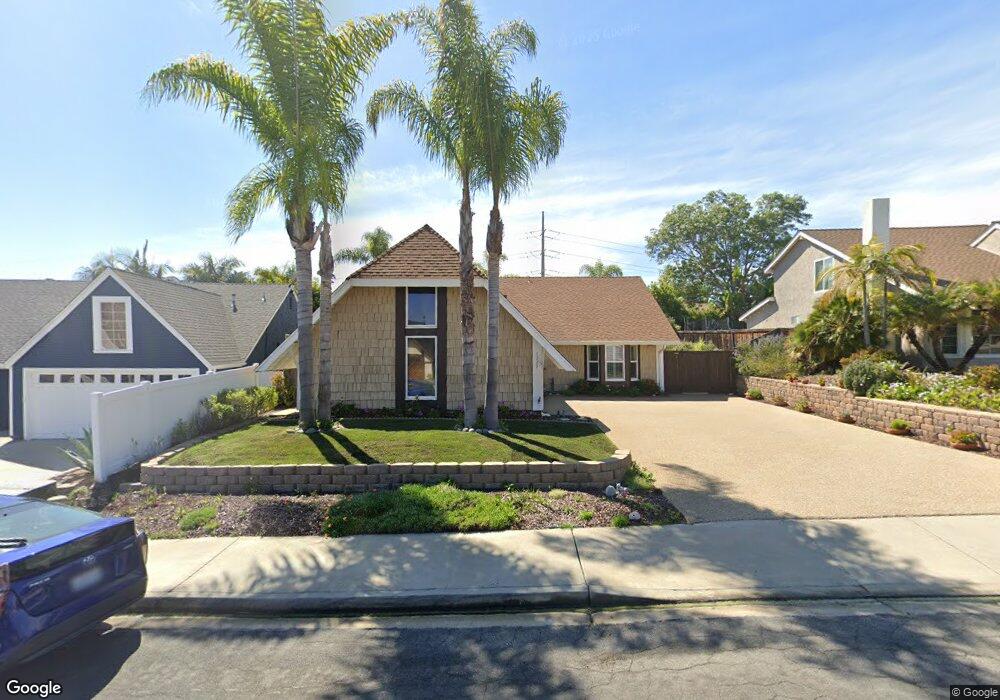
1729 Catalpa Rd Carlsbad, CA 92011
La Costa NeighborhoodEstimated Value: $1,258,448 - $1,614,000
3
Beds
2
Baths
1,512
Sq Ft
$966/Sq Ft
Est. Value
About This Home
This home is located at 1729 Catalpa Rd, Carlsbad, CA 92011 and is currently estimated at $1,460,362, approximately $965 per square foot. 1729 Catalpa Rd is a home located in San Diego County with nearby schools including Aviara Oaks Elementary, Aviara Oaks Middle, and Sage Creek High.
Ownership History
Date
Name
Owned For
Owner Type
Purchase Details
Closed on
Jul 26, 2010
Sold by
Esqueda Crismon Carl Junius and Esqueda Crismon Melissa Beth
Bought by
Oberding Mary Jane and Allan Barrett
Current Estimated Value
Home Financials for this Owner
Home Financials are based on the most recent Mortgage that was taken out on this home.
Original Mortgage
$417,000
Outstanding Balance
$275,398
Interest Rate
4.52%
Mortgage Type
New Conventional
Estimated Equity
$1,184,964
Purchase Details
Closed on
Aug 17, 2004
Sold by
Iannessa John P
Bought by
Esqueda Crimson Carl Junius and Esqueda Crimson Melissa Beth
Home Financials for this Owner
Home Financials are based on the most recent Mortgage that was taken out on this home.
Original Mortgage
$424,500
Interest Rate
5.37%
Mortgage Type
New Conventional
Purchase Details
Closed on
May 1, 2004
Sold by
Iannessa Ralph Edward
Bought by
Iannessa Ralph Edward
Create a Home Valuation Report for This Property
The Home Valuation Report is an in-depth analysis detailing your home's value as well as a comparison with similar homes in the area
Home Values in the Area
Average Home Value in this Area
Purchase History
| Date | Buyer | Sale Price | Title Company |
|---|---|---|---|
| Oberding Mary Jane | $565,000 | Ticor Title Company | |
| Esqueda Crimson Carl Junius | $566,000 | Fidelity National Title Co | |
| Iannessa Ralph Edward | -- | -- |
Source: Public Records
Mortgage History
| Date | Status | Borrower | Loan Amount |
|---|---|---|---|
| Open | Oberding Mary Jane | $417,000 | |
| Previous Owner | Esqueda Crimson Carl Junius | $424,500 | |
| Closed | Esqueda Crimson Carl Junius | $45,000 |
Source: Public Records
Tax History
| Year | Tax Paid | Tax Assessment Tax Assessment Total Assessment is a certain percentage of the fair market value that is determined by local assessors to be the total taxable value of land and additions on the property. | Land | Improvement |
|---|---|---|---|---|
| 2025 | $855 | $79,128 | $34,049 | $45,079 |
| 2024 | $855 | $77,578 | $33,382 | $44,196 |
| 2023 | $849 | $76,058 | $32,728 | $43,330 |
| 2022 | $835 | $74,568 | $32,087 | $42,481 |
| 2021 | $828 | $73,107 | $31,458 | $41,649 |
| 2020 | $822 | $72,358 | $31,136 | $41,222 |
| 2019 | $808 | $70,940 | $30,526 | $40,414 |
| 2018 | $776 | $69,550 | $29,928 | $39,622 |
| 2017 | $90 | $68,188 | $29,342 | $38,846 |
| 2016 | $732 | $66,852 | $28,767 | $38,085 |
| 2015 | $729 | $65,848 | $28,335 | $37,513 |
| 2014 | $717 | $64,559 | $27,780 | $36,779 |
Source: Public Records
Map
Nearby Homes
- 7062 Rock Dove St
- 1736 Blackbird Cir
- 7101 Mimosa Dr
- 25 El Camino Real
- 7161 Tanager Dr
- 1667 Plover Ct
- 7132 Tern Place
- 1915 Estrella de Mar Ct Unit C
- 1915 Estrella de Mar Ct Unit A
- 6852 Widgeon Place Unit 78
- 7323 Estrella de Mar Rd Unit 41
- 1939 Alga Rd Unit A
- 1913 Alga Rd Unit A
- 1933 Alga Rd Unit C
- 7319 Estrella de Mar Rd
- 7026 Estrella de Mar Rd
- 2005 Costa Del Mar Rd Unit 630
- 2005 Costa Del Mar Rd Unit 636
- 2003 Costa Del Mar Rd Unit 671
- 2003 Costa Del Mar Rd Unit 678
- 1727 Catalpa Rd
- 1731 Catalpa Rd
- 7238 Mimosa Dr
- 1725 Catalpa Rd
- 7236 Mimosa Dr
- 1733 Catalpa Rd
- 7240 Mimosa Dr
- 1732 Catalpa Rd
- 1734 Catalpa Rd
- 7242 Mimosa Dr
- 1723 Catalpa Rd
- 1735 Catalpa Rd
- 1730 Catalpa Rd
- 1736 Catalpa Rd
- 7232 Mimosa Dr
- 1728 Catalpa Rd
- 7244 Mimosa Dr
- 1721 Catalpa Rd
- 1726 Catalpa Rd
- 1737 Catalpa Rd
Your Personal Tour Guide
Ask me questions while you tour the home.