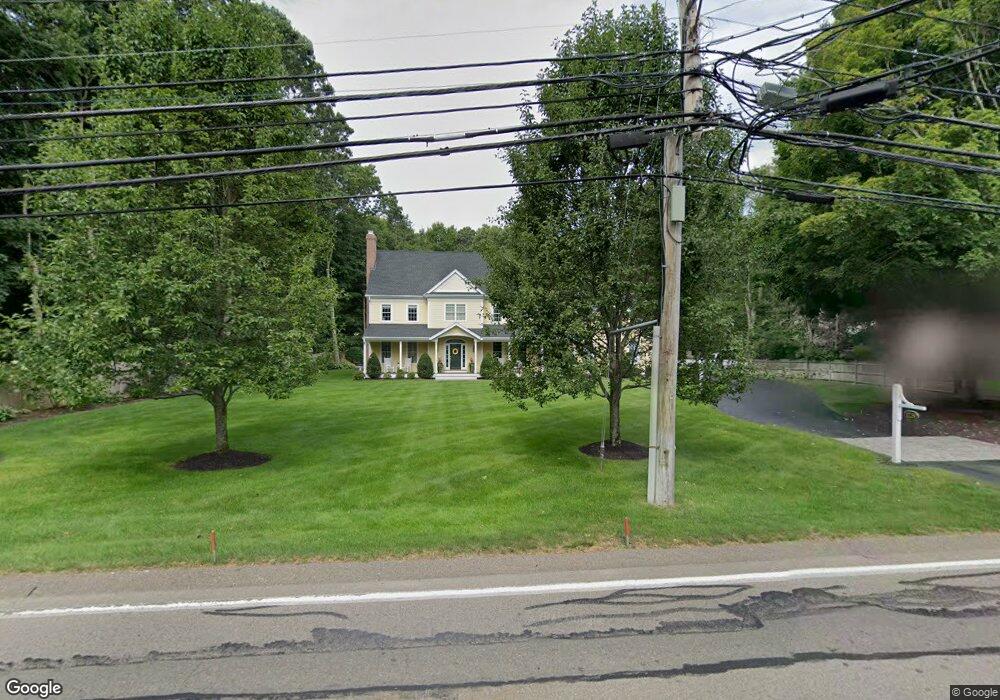
1729 Central Ave Needham, MA 02492
Estimated Value: $1,934,000 - $2,674,000
4
Beds
4
Baths
2,274
Sq Ft
$988/Sq Ft
Est. Value
About This Home
This home is located at 1729 Central Ave, Needham, MA 02492 and is currently estimated at $2,245,983, approximately $987 per square foot. 1729 Central Ave is a home located in Norfolk County with nearby schools including Newman Elementary School, High Rock Middle School, and Pollard Middle School.
Ownership History
Date
Name
Owned For
Owner Type
Purchase Details
Closed on
Feb 23, 2023
Sold by
Jonasson Carl H
Bought by
Carl H Jonasson Ft
Current Estimated Value
Purchase Details
Closed on
Nov 23, 1998
Sold by
Roycroft Thomas J and Roycroft Carolyn M
Bought by
Jonasson Carl J and Jonasson Marie L
Home Financials for this Owner
Home Financials are based on the most recent Mortgage that was taken out on this home.
Original Mortgage
$475,000
Interest Rate
6.49%
Mortgage Type
Purchase Money Mortgage
Purchase Details
Closed on
Nov 4, 1987
Sold by
Webster Cheryl A
Bought by
Roycroft Thomas J
Home Financials for this Owner
Home Financials are based on the most recent Mortgage that was taken out on this home.
Original Mortgage
$45,000
Interest Rate
10.97%
Mortgage Type
Purchase Money Mortgage
Create a Home Valuation Report for This Property
The Home Valuation Report is an in-depth analysis detailing your home's value as well as a comparison with similar homes in the area
Home Values in the Area
Average Home Value in this Area
Purchase History
| Date | Buyer | Sale Price | Title Company |
|---|---|---|---|
| Carl H Jonasson Ft | -- | None Available | |
| Jonasson Carl H | -- | None Available | |
| Jonasson Carl J | $375,000 | -- | |
| Roycroft Thomas J | $300,000 | -- |
Source: Public Records
Mortgage History
| Date | Status | Borrower | Loan Amount |
|---|---|---|---|
| Previous Owner | Roycroft Thomas J | $330,972 | |
| Previous Owner | Roycroft Thomas J | $400,000 | |
| Previous Owner | Roycroft Thomas J | $475,000 | |
| Previous Owner | Roycroft Thomas J | $45,000 |
Source: Public Records
Tax History
| Year | Tax Paid | Tax Assessment Tax Assessment Total Assessment is a certain percentage of the fair market value that is determined by local assessors to be the total taxable value of land and additions on the property. | Land | Improvement |
|---|---|---|---|---|
| 2025 | $18,107 | $1,708,200 | $708,400 | $999,800 |
| 2024 | $16,453 | $1,314,100 | $569,800 | $744,300 |
| 2023 | $16,387 | $1,256,700 | $569,800 | $686,900 |
| 2022 | $14,476 | $1,082,700 | $431,800 | $650,900 |
| 2021 | $14,108 | $1,082,700 | $431,800 | $650,900 |
| 2020 | $13,187 | $1,055,800 | $431,800 | $624,000 |
| 2019 | $13,003 | $1,049,500 | $431,800 | $617,700 |
| 2018 | $12,468 | $1,049,500 | $431,800 | $617,700 |
| 2017 | $13,141 | $1,105,200 | $431,800 | $673,400 |
| 2016 | $12,754 | $1,105,200 | $431,800 | $673,400 |
| 2015 | $12,478 | $1,105,200 | $431,800 | $673,400 |
| 2014 | $12,641 | $1,086,000 | $431,800 | $654,200 |
Source: Public Records
Map
Nearby Homes
- 1780 Central Ave
- 37 Carleton Dr
- 365 Charles River St
- 24 Moseley Ave
- 34 Stratford Rd
- 189 Bridle Trail Rd
- 8 Crestview Rd
- 52 Willow St
- 60 Claybrook Rd
- 62 Claybrook Rd
- 95 Deerfield Rd
- 1 Mill St
- 620 High Rock St
- 389 Grove St
- 333 Cartwright Rd
- 68 Locust Ln
- 287 High Rock St
- 21 Brewster Dr
- 37 Standish Rd
- 957 South St
- 1719 Central Ave
- 253 Charles River St
- 275 Charles River St
- 1711 Central Ave
- 1703 Central Ave
- 285 Charles River St
- 7 Country Way
- 272 Charles River St
- 16 Country Way
- 1708 Central Ave
- 1750 Central Ave
- 1695 Central Ave
- 260 Charles River St
- 248 Charles River St
- 299 Charles River St
- 288 Charles River St
- 1689 Central Ave
- 300 Charles River St
- 45 Village Ln
- 1775 Central Ave
Your Personal Tour Guide
Ask me questions while you tour the home.