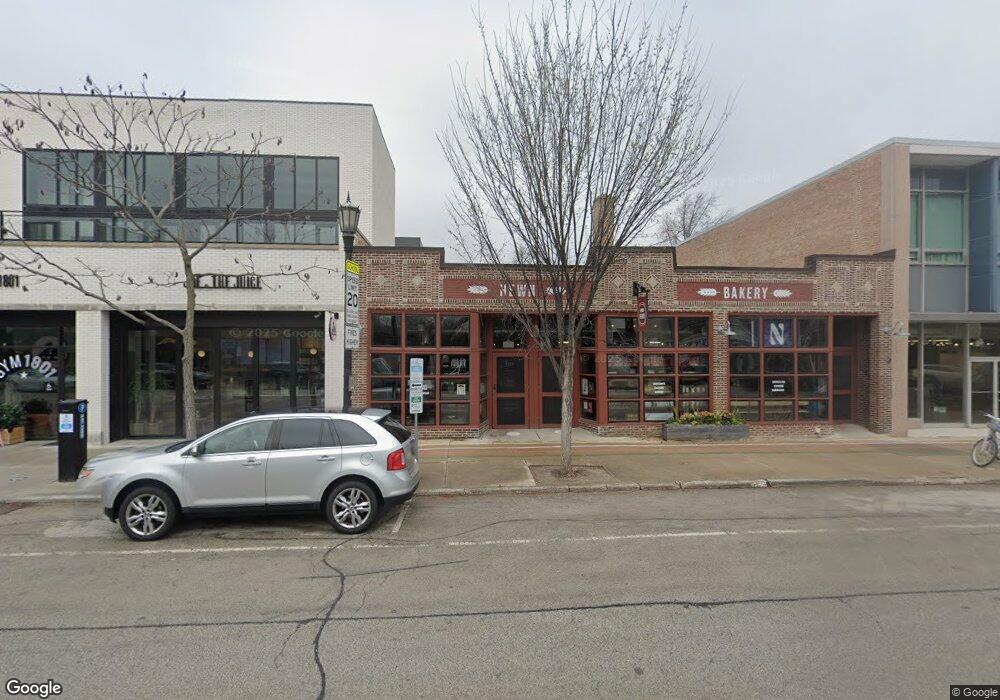
1729 Central St Evanston, IL 60201
Central Street Neighborhood
--
Bed
--
Bath
--
Sq Ft
6,970
Sq Ft Lot
About This Home
This home is located at 1729 Central St, Evanston, IL 60201. 1729 Central St is a home located in Cook County with nearby schools including Kingsley Elementary School, Haven Middle School, and Evanston Township High School.
Ownership History
Date
Name
Owned For
Owner Type
Purchase Details
Closed on
Aug 30, 2019
Sold by
49 Salem Lane Llc
Bought by
Oxcart Llc
Home Financials for this Owner
Home Financials are based on the most recent Mortgage that was taken out on this home.
Original Mortgage
$1,381,500
Outstanding Balance
$1,231,448
Interest Rate
4.5%
Mortgage Type
Construction
Purchase Details
Closed on
Jan 8, 2008
Sold by
Jmdk Llc
Bought by
49 Salem Lane Llc
Home Financials for this Owner
Home Financials are based on the most recent Mortgage that was taken out on this home.
Original Mortgage
$706,400
Interest Rate
7%
Mortgage Type
Commercial
Purchase Details
Closed on
Sep 3, 2007
Sold by
Evanston Central Ii Llc
Bought by
Jmdk Llc
Purchase Details
Closed on
Aug 18, 2006
Sold by
Nazarian Joy
Bought by
Evanston Central Ii Llc
Home Financials for this Owner
Home Financials are based on the most recent Mortgage that was taken out on this home.
Original Mortgage
$800,000
Interest Rate
6.83%
Mortgage Type
Seller Take Back
Create a Home Valuation Report for This Property
The Home Valuation Report is an in-depth analysis detailing your home's value as well as a comparison with similar homes in the area
Home Values in the Area
Average Home Value in this Area
Purchase History
| Date | Buyer | Sale Price | Title Company |
|---|---|---|---|
| Oxcart Llc | $795,000 | Chicago Title | |
| 49 Salem Lane Llc | $883,000 | None Available | |
| Jmdk Llc | $1,962,500 | None Available | |
| Evanston Central Ii Llc | $1,550,000 | None Available |
Source: Public Records
Mortgage History
| Date | Status | Borrower | Loan Amount |
|---|---|---|---|
| Open | Oxcart Llc | $1,381,500 | |
| Previous Owner | 49 Salem Lane Llc | $706,400 | |
| Previous Owner | Evanston Central Ii Llc | $800,000 |
Source: Public Records
Tax History Compared to Growth
Tax History
| Year | Tax Paid | Tax Assessment Tax Assessment Total Assessment is a certain percentage of the fair market value that is determined by local assessors to be the total taxable value of land and additions on the property. | Land | Improvement |
|---|---|---|---|---|
| 2024 | $24,061 | $95,499 | $17,825 | $77,674 |
| 2023 | $22,135 | $95,499 | $17,825 | $77,674 |
| 2022 | $22,135 | $91,427 | $17,825 | $73,602 |
| 2021 | $35,190 | $127,553 | $17,825 | $109,728 |
| 2020 | $17,996 | $66,038 | $17,825 | $48,213 |
| 2019 | $48,596 | $198,750 | $38,750 | $160,000 |
| 2018 | $47,799 | $174,464 | $37,296 | $137,168 |
| 2017 | $46,551 | $174,464 | $37,296 | $137,168 |
| 2016 | $44,152 | $174,464 | $37,296 | $137,168 |
| 2015 | $44,625 | $166,429 | $33,906 | $132,523 |
| 2014 | $44,200 | $166,429 | $33,906 | $132,523 |
| 2013 | $43,184 | $166,429 | $33,906 | $132,523 |
Source: Public Records
Map
Nearby Homes
- 2635 Poplar Ave
- 2539.5 Prairie Ave Unit 3W
- 2741 Eastwood Ave
- 2108 Harrison St
- 2015 Colfax St
- 2135 Central St Unit 3W
- 2020 Colfax St
- 1915 Grant St
- 1910 Grant St
- 1918 Noyes St
- 2017 Jackson Ave
- 250 3rd St
- 2118 Jackson Ave
- 526 Linden Ave
- 2236 Ridge Ave
- 2353 Ridge Ave
- 1209 Maple Ave
- 2005 Darrow Ave
- 2720 Central St Unit 4C
- 2026 Green Bay Rd
- 1801 Central St
- 1731 Central St
- 1717 Central St Unit 106
- 2617 Broadway Ave
- 1730 Chancellor St
- 2611 Broadway Ave
- 1726 Chancellor St
- 1724 Chancellor St
- 1800 Chancellor St
- 1800 Central St
- 1722 Chancellor St
- 1713 Central St
- 1732 Central St
- 1806 Chancellor St
- 1720 Chancellor St
- 2627 Broadway Ave
- 1720 Central St Unit 422
- 1720 Central St Unit 215
- 1720 Central St Unit 410
- 1720 Central St Unit 417