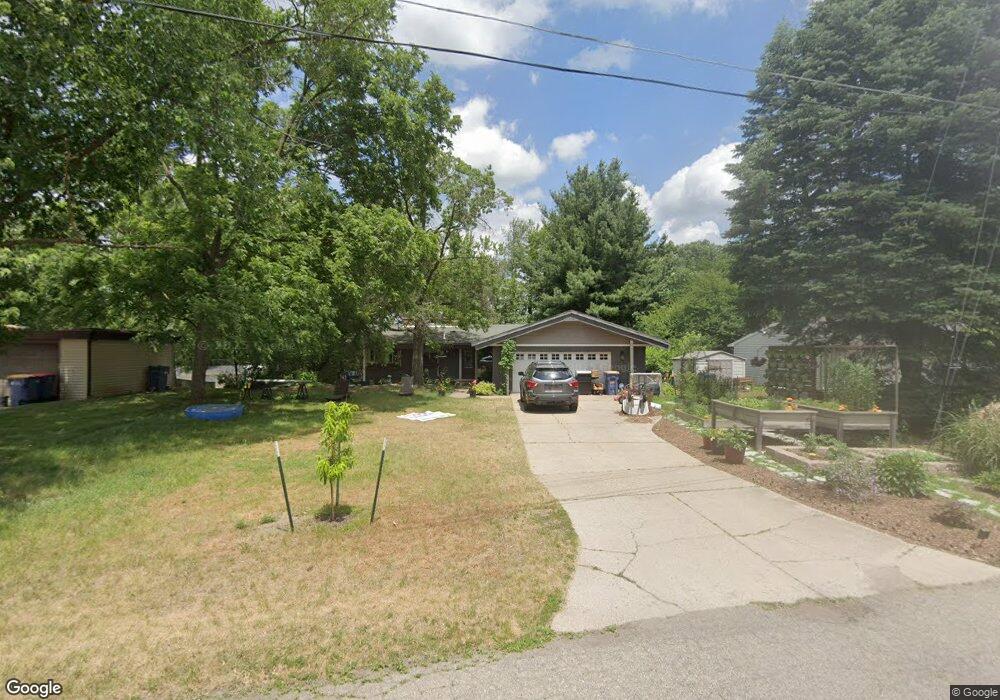
1729 Dorais Ct NE Grand Rapids, MI 49525
Northview NeighborhoodEstimated Value: $345,000 - $374,253
5
Beds
2
Baths
2,700
Sq Ft
$135/Sq Ft
Est. Value
About This Home
This home is located at 1729 Dorais Ct NE, Grand Rapids, MI 49525 and is currently estimated at $365,813, approximately $135 per square foot. 1729 Dorais Ct NE is a home located in Kent County with nearby schools including Riverside Middle School, Union High School, and All Saints Academy - Upper Campus.
Ownership History
Date
Name
Owned For
Owner Type
Purchase Details
Closed on
Jul 15, 2019
Sold by
Braun Wesley M
Bought by
Braun Wesley M and Braun Nicole M
Current Estimated Value
Home Financials for this Owner
Home Financials are based on the most recent Mortgage that was taken out on this home.
Original Mortgage
$138,400
Outstanding Balance
$121,251
Interest Rate
3.82%
Mortgage Type
New Conventional
Estimated Equity
$244,562
Purchase Details
Closed on
Apr 22, 2011
Sold by
Fannie Mae
Bought by
Braun Wesley M
Home Financials for this Owner
Home Financials are based on the most recent Mortgage that was taken out on this home.
Original Mortgage
$109,160
Interest Rate
4.88%
Mortgage Type
FHA
Purchase Details
Closed on
Dec 21, 2009
Sold by
Mortgage Electronic Registration Systems
Bought by
Federal National Mortgage Association
Purchase Details
Closed on
Dec 16, 2009
Sold by
Devroy Beth A and Devroy David L
Bought by
Mortgage Electronic Registration Systems
Purchase Details
Closed on
Feb 26, 1991
Sold by
Banaszak Banaszak M M and Banaszak London S
Bought by
Braun Wesley M
Create a Home Valuation Report for This Property
The Home Valuation Report is an in-depth analysis detailing your home's value as well as a comparison with similar homes in the area
Home Values in the Area
Average Home Value in this Area
Purchase History
| Date | Buyer | Sale Price | Title Company |
|---|---|---|---|
| Braun Wesley M | -- | None Available | |
| Braun Wesley M | $112,000 | Attorneys Title Agency Llc | |
| Federal National Mortgage Association | -- | None Available | |
| Mortgage Electronic Registration Systems | $161,571 | None Available | |
| Braun Wesley M | $113,000 | -- |
Source: Public Records
Mortgage History
| Date | Status | Borrower | Loan Amount |
|---|---|---|---|
| Open | Braun Wesley M | $138,400 | |
| Closed | Braun Wesley M | $109,160 |
Source: Public Records
Tax History Compared to Growth
Tax History
| Year | Tax Paid | Tax Assessment Tax Assessment Total Assessment is a certain percentage of the fair market value that is determined by local assessors to be the total taxable value of land and additions on the property. | Land | Improvement |
|---|---|---|---|---|
| 2025 | $2,759 | $157,700 | $0 | $0 |
| 2024 | $2,759 | $138,700 | $0 | $0 |
| 2023 | $2,642 | $128,200 | $0 | $0 |
| 2022 | $2,657 | $112,200 | $0 | $0 |
| 2021 | $2,446 | $83,000 | $0 | $0 |
| 2020 | $2,484 | $81,000 | $0 | $0 |
| 2019 | $2,601 | $82,300 | $0 | $0 |
| 2018 | $2,512 | $84,700 | $0 | $0 |
| 2017 | $2,450 | $80,900 | $0 | $0 |
| 2016 | $2,479 | $78,100 | $0 | $0 |
| 2015 | $2,302 | $78,100 | $0 | $0 |
| 2013 | -- | $67,700 | $0 | $0 |
Source: Public Records
Map
Nearby Homes
- 1985 Oakcliff Dr NE
- 1710 Kreft St NE
- 1860 Kreft St NE
- 3644 Ivy Dr NE
- 2031 Garret Dr NE
- 2089 Elmer Dr NE
- 1444 Mark St NE
- 3136 Fuller Ave NE
- 2313 4 Mile Rd NE
- 2833 Aldale Dr NE
- 1955 3 Mile Rd NE
- 3750 Benjamin Ave NE
- 2958 Dean Lake Ave NE
- 3886 Vineyard Ave NE
- 2258-B Edgewater Dr NE
- 3030 Plainfield Ave NE
- 1030 4 Mile Rd NE
- 1313 Ellsmere St NE
- 3530 Wild Rose Ln NE
- 4148 Chadwick Ave NE
- 1723 Dorais Ct NE
- 1735 Dorais Ct NE
- 1765 Lamberton Lake Dr NE
- 3308 Dorais Dr NE
- 3319 Shadyside Dr NE
- 1755 Lamberton Lake Dr NE
- 1735 Lamberton Lake Dr NE
- 3353 Dorais Dr NE
- 3300 Dorais Dr NE
- 1742 Dorais Ct NE
- 3262 Dorais Dr NE
- 3311 Dorais Dr NE
- 1805 Oakcliff Dr NE
- 3303 Dorais Dr NE
- 1707 Lamberton Lake Dr NE
- 1720 Rupert St NE
- 3300 Shadyside Dr NE
- 3265 Dorais Dr NE
- 1651 Vanderjagt Dr NE
- 3256 Dorais Dr NE