
1729 Lang Place NE Washington, DC 20002
Langston Neighborhood
3
Beds
2.5
Baths
1,084
Sq Ft
1,719
Sq Ft Lot
Highlights
- Colonial Architecture
- Galley Kitchen
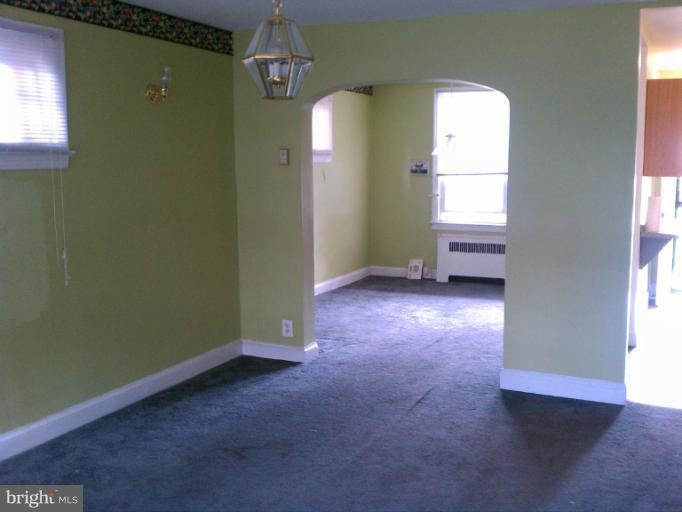
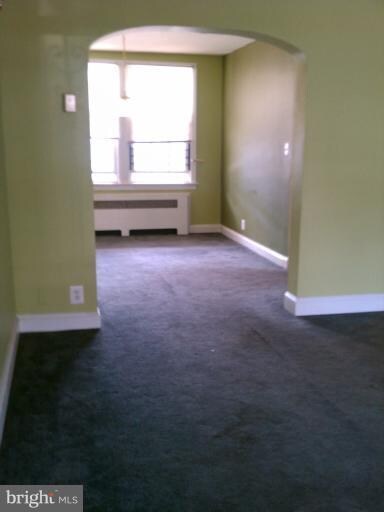
- Dining Area
- No HOA
- Forced Air Heating System
About This Home
As of November 2019Kitchen has been updated. There is a 2nd kitchen in basement. Electricity is off. There is evidence of mold in the back room in basement..
Townhouse Details
Home Type
- Townhome
Est. Annual Taxes
- $2,220
Year Built
- Built in 1937
Lot Details
- 1,719 Sq Ft Lot
- Two or More Common Walls
Parking
- On-Street Parking
Home Design
- Colonial Architecture
- Brick Exterior Construction
Interior Spaces
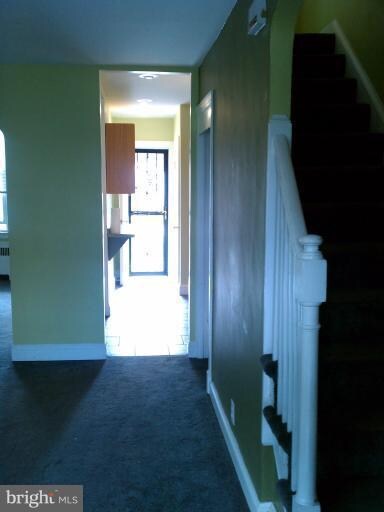
- Property has 3 Levels
- Window Treatments
- Dining Area
Kitchen
- Galley Kitchen
- Stove
Bedrooms and Bathrooms
- 3 Bedrooms
- 2.5 Bathrooms
Basement
- Walk-Out Basement
- Basement Fills Entire Space Under The House
- Rear Basement Entry
Utilities
- Forced Air Heating System
- Vented Exhaust Fan
- Natural Gas Water Heater
Community Details
- No Home Owners Association
Listing and Financial Details
- Tax Lot 129
- Assessor Parcel Number 4470//0129
Ownership History
Date
Name
Owned For
Owner Type
Purchase Details
Listed on
Jul 18, 2019
Closed on
Nov 4, 2019
Sold by
Hardee Michael T
Bought by
Guerrero and Barragan Angelica Maria
Seller's Agent
Marc Fleisher
Compass
Buyer's Agent
Aiden Berri
Samson Properties
List Price
$575,000
Sold Price
$540,000
Premium/Discount to List
-$35,000
-6.09%
Current Estimated Value
Home Financials for this Owner
Home Financials are based on the most recent Mortgage that was taken out on this home.
Estimated Appreciation
$64,854
Avg. Annual Appreciation
1.96%
Original Mortgage
$484,350
Outstanding Balance
$427,943
Interest Rate
3.6%
Estimated Equity
$176,911
Purchase Details
Listed on
Oct 16, 2017
Closed on
Nov 20, 2017
Sold by
Rauscher Christopher and Rauscher Eliza
Bought by
Hardee Michael T
Seller's Agent
Katherine Bertles Hennigan
Corcoran McEnearney
Buyer's Agent
John Lesniewski
RE/MAX United Real Estate
List Price
$499,000
Sold Price
$520,000
Premium/Discount to List
$21,000
4.21%
Home Financials for this Owner
Home Financials are based on the most recent Mortgage that was taken out on this home.
Avg. Annual Appreciation
1.96%
Original Mortgage
$476,002
Interest Rate
3.91%
Mortgage Type
New Conventional
Purchase Details
Listed on
Oct 22, 2013
Closed on
Jan 10, 2014
Sold by
1729 Lang Pl Llc
Bought by
Rauscher Eliza and Rauscher Christopher
Seller's Agent
Bode Akinola
Paragon Realty, LLC
Buyer's Agent
Katherine Bertles Hennigan
Corcoran McEnearney
List Price
$385,000
Sold Price
$355,000
Premium/Discount to List
-$30,000
-7.79%
Home Financials for this Owner
Home Financials are based on the most recent Mortgage that was taken out on this home.
Avg. Annual Appreciation
10.34%
Original Mortgage
$344,350
Interest Rate
4.29%
Mortgage Type
New Conventional
Similar Homes in Washington, DC
Create a Home Valuation Report for This Property
The Home Valuation Report is an in-depth analysis detailing your home's value as well as a comparison with similar homes in the area
Home Values in the Area
Average Home Value in this Area
Purchase History
| Date | Type | Sale Price | Title Company |
|---|---|---|---|
| Warranty Deed | $540,000 | Pinnacle Title & Escrow Inc | |
| Special Warranty Deed | $520,000 | Attorney | |
| Deed | -- | -- |
Source: Public Records
Mortgage History
| Date | Status | Loan Amount | Loan Type |
|---|---|---|---|
| Open | $484,350 | No Value Available | |
| Previous Owner | $484,350 | New Conventional | |
| Previous Owner | $476,002 | New Conventional | |
| Previous Owner | $355,500 | New Conventional | |
| Previous Owner | $344,350 | New Conventional | |
| Previous Owner | $260,000 | Future Advance Clause Open End Mortgage | |
| Previous Owner | $412,500 | Reverse Mortgage Home Equity Conversion Mortgage | |
| Previous Owner | $376,500 | Reverse Mortgage Home Equity Conversion Mortgage |
Source: Public Records
Property History
| Date | Event | Price | Change | Sq Ft Price |
|---|---|---|---|---|
| 11/04/2019 11/04/19 | Sold | $540,000 | -0.9% | $363 / Sq Ft |
| 10/05/2019 10/05/19 | Pending | -- | -- | -- |
| 09/20/2019 09/20/19 | Price Changed | $545,000 | -0.5% | $366 / Sq Ft |
| 09/05/2019 09/05/19 | Price Changed | $548,000 | -2.0% | $368 / Sq Ft |
| 08/16/2019 08/16/19 | Price Changed | $559,000 | -2.8% | $376 / Sq Ft |
| 07/18/2019 07/18/19 | For Sale | $575,000 | +10.6% | $386 / Sq Ft |
| 11/27/2017 11/27/17 | Sold | $520,000 | +4.2% | $480 / Sq Ft |
| 10/21/2017 10/21/17 | Pending | -- | -- | -- |
| 10/16/2017 10/16/17 | For Sale | $499,000 | +40.6% | $460 / Sq Ft |
| 01/10/2014 01/10/14 | Sold | $355,000 | -7.8% | $327 / Sq Ft |
| 12/04/2013 12/04/13 | Pending | -- | -- | -- |
| 10/22/2013 10/22/13 | For Sale | $385,000 | +57.1% | $355 / Sq Ft |
| 03/25/2013 03/25/13 | Sold | $245,000 | -12.5% | $226 / Sq Ft |
| 10/26/2012 10/26/12 | Pending | -- | -- | -- |
| 06/09/2012 06/09/12 | For Sale | $280,000 | +14.3% | $258 / Sq Ft |
| 06/04/2012 06/04/12 | Off Market | $245,000 | -- | -- |
| 03/23/2012 03/23/12 | Price Changed | $280,000 | -6.7% | $258 / Sq Ft |
| 10/10/2011 10/10/11 | Price Changed | $299,999 | 0.0% | $277 / Sq Ft |
| 09/09/2011 09/09/11 | For Sale | $300,000 | -- | $277 / Sq Ft |
Source: Bright MLS
Tax History Compared to Growth
Tax History
| Year | Tax Paid | Tax Assessment Tax Assessment Total Assessment is a certain percentage of the fair market value that is determined by local assessors to be the total taxable value of land and additions on the property. | Land | Improvement |
|---|---|---|---|---|
| 2024 | $5,172 | $695,460 | $357,160 | $338,300 |
| 2023 | $4,987 | $670,730 | $356,980 | $313,750 |
| 2022 | $4,864 | $650,940 | $322,170 | $328,770 |
| 2021 | $4,545 | $611,030 | $310,670 | $300,360 |
| 2020 | $4,322 | $584,200 | $294,650 | $289,550 |
| 2019 | $4,010 | $546,570 | $274,250 | $272,320 |
| 2018 | $3,082 | $476,490 | $0 | $0 |
| 2017 | $2,809 | $456,400 | $0 | $0 |
| 2016 | $2,559 | $398,910 | $0 | $0 |
| 2015 | $2,329 | $345,400 | $0 | $0 |
| 2014 | $1,041 | $194,320 | $0 | $0 |
Source: Public Records
Agents Affiliated with this Home
-
Marc Fleisher
Seller's Agent in 2019
Marc Fleisher
Compass
(202) 438-4880
101 Total Sales
-
Ben Rivlin
B
Seller Co-Listing Agent in 2019
Ben Rivlin
Keller Williams Capital Properties
(240) 687-0486
21 Total Sales
-
Aiden Berri
Buyer's Agent in 2019
Aiden Berri
Samson Properties
(202) 779-7829
82 Total Sales
-
Katherine Bertles Hennigan
Seller's Agent in 2017
Katherine Bertles Hennigan
Corcoran McEnearney
(202) 321-3427
72 Total Sales
-
John Lesniewski
Buyer's Agent in 2017
John Lesniewski
RE/MAX
(301) 702-4228
269 Total Sales
-
Bode Akinola
Seller's Agent in 2014
Bode Akinola
Paragon Realty, LLC
(301) 910-2673
1 in this area
74 Total Sales
Map
Source: Bright MLS
MLS Number: 1004583012
APN: 4470-0129
Disclaimer: Certain information contained herein is derived from information provided by parties other than Homes.com. All information provided is deemed reliable, but is not guaranteed to be accurate and should be independently verified.
![]() The data relating to real estate for sale on this website appears in part through the BRIGHT Internet Data Exchange program, a voluntary cooperative exchange of property listing data between licensed real estate brokerage firms, and is provided by BRIGHT through a licensing agreement.
The data relating to real estate for sale on this website appears in part through the BRIGHT Internet Data Exchange program, a voluntary cooperative exchange of property listing data between licensed real estate brokerage firms, and is provided by BRIGHT through a licensing agreement.
Listing information is from various brokers who participate in the Bright MLS IDX program and not all listings may be visible on the site.
The property information being provided on or through the website is for the personal, non-commercial use of consumers and such information may not be used for any purpose other than to identify prospective properties consumers may be interested in purchasing.
Some properties which appear for sale on the website may no longer be available because they are for instance, under contract, sold or are no longer being offered for sale.
Property information displayed is deemed reliable but is not guaranteed.
Copyright 2025 Bright MLS, Inc.
Nearby Homes
- 1831 L St NE
- 1709 Lang Place NE
- 1024 18th St NE
- 1019 18th St NE
- 1733 L St NE
- 1702 Lang Place NE
- 1759 Lyman Place NE
- 1729 L St NE
- 1013 17th St NE
- 1778 Lang Place NE
- 1004 18th St NE Unit 2
- 1002 18th St NE
- 1764 Lyman Place NE
- 1813 M St NE
- 1621 Lyman Place NE
- 1019 17th Place NE Unit 1
- 1701 M St NE Unit 1
- 1701 M St NE Unit 2
- 1140 17th St NE Unit 2
- 1140 17th St NE Unit 5