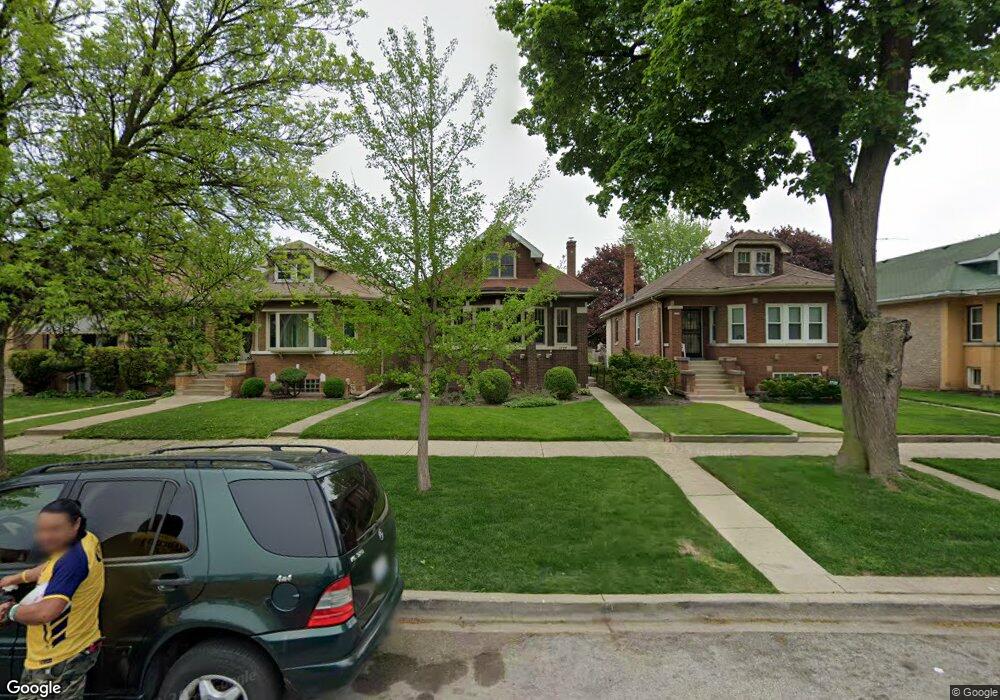
1729 N Nagle Ave Chicago, IL 60707
Galewood NeighborhoodEstimated Value: $349,789 - $386,000
3
Beds
1
Bath
1,192
Sq Ft
$308/Sq Ft
Est. Value
About This Home
This home is located at 1729 N Nagle Ave, Chicago, IL 60707 and is currently estimated at $366,697, approximately $307 per square foot. 1729 N Nagle Ave is a home located in Cook County with nearby schools including Lovett Elementary School, Steinmetz College Prep, and Acero - Roberto Clemente Elementary School.
Ownership History
Date
Name
Owned For
Owner Type
Purchase Details
Closed on
Oct 2, 2024
Sold by
Davison Rick and Kosinski Ann
Bought by
Rick D Davison And Ann C Kosinski Revocable L and Davison
Current Estimated Value
Purchase Details
Closed on
Mar 19, 2007
Sold by
Farris Paul L
Bought by
Davison Rick and Kosinski Ann
Home Financials for this Owner
Home Financials are based on the most recent Mortgage that was taken out on this home.
Original Mortgage
$264,000
Interest Rate
6.2%
Mortgage Type
Unknown
Purchase Details
Closed on
Oct 7, 2003
Sold by
Franciose Barbara D and Sindewald Kathleen
Bought by
Farris Paul L
Home Financials for this Owner
Home Financials are based on the most recent Mortgage that was taken out on this home.
Original Mortgage
$159,200
Interest Rate
6.49%
Mortgage Type
Unknown
Purchase Details
Closed on
Oct 22, 1997
Sold by
Shea Mary Therese
Bought by
Shea Mary Therese and Mary Therese Shea Trust
Create a Home Valuation Report for This Property
The Home Valuation Report is an in-depth analysis detailing your home's value as well as a comparison with similar homes in the area
Home Values in the Area
Average Home Value in this Area
Purchase History
| Date | Buyer | Sale Price | Title Company |
|---|---|---|---|
| Rick D Davison And Ann C Kosinski Revocable L | -- | None Listed On Document | |
| Davison Rick | $330,000 | The Talon Group | |
| Farris Paul L | $199,000 | Git | |
| Shea Mary Therese | -- | -- |
Source: Public Records
Mortgage History
| Date | Status | Borrower | Loan Amount |
|---|---|---|---|
| Previous Owner | Davison Rick | $264,000 | |
| Previous Owner | Farris Paul L | $159,200 |
Source: Public Records
Tax History Compared to Growth
Tax History
| Year | Tax Paid | Tax Assessment Tax Assessment Total Assessment is a certain percentage of the fair market value that is determined by local assessors to be the total taxable value of land and additions on the property. | Land | Improvement |
|---|---|---|---|---|
| 2024 | $3,944 | $27,000 | $14,999 | $12,001 |
| 2023 | $3,823 | $22,001 | $11,356 | $10,645 |
| 2022 | $3,823 | $22,001 | $11,356 | $10,645 |
| 2021 | $3,756 | $21,999 | $11,355 | $10,644 |
| 2020 | $4,548 | $23,506 | $6,487 | $17,019 |
| 2019 | $4,620 | $26,412 | $6,487 | $19,925 |
| 2018 | $4,541 | $26,412 | $6,487 | $19,925 |
| 2017 | $4,432 | $23,950 | $5,709 | $18,241 |
| 2016 | $4,299 | $23,950 | $5,709 | $18,241 |
| 2015 | $3,910 | $23,950 | $5,709 | $18,241 |
| 2014 | $3,728 | $22,647 | $5,190 | $17,457 |
| 2013 | $3,643 | $22,647 | $5,190 | $17,457 |
Source: Public Records
Map
Nearby Homes
- 1627 N Narragansett Ave
- 1221 Edmer Ave
- 1700 N Natoma Ave
- 1639 N Normandy Ave
- 1227 N East Ave
- 1212 N Harvey Ave
- 1122 N Ridgeland Ave
- 1937 N Normandy Ave
- 1221 Hayes Ave
- 1733 N Oak Park Ave
- 1104 Fair Oaks Ave
- 1715 N Meade Ave
- 102 Le Moyne Pkwy
- 1618 N Mcvicker Ave
- 34 Le Moyne Pkwy
- 1115 N Taylor Ave
- 1657 N Austin Ave
- 1003 Mapleton Ave
- 1600 N New England Ave Unit 4
- 936 N Ridgeland Ave
- 1731 N Nagle Ave
- 1725 N Nagle Ave
- 1735 N Nagle Ave
- 1719 N Nagle Ave
- 1737 N Nagle Ave
- 1717 N Nagle Ave
- 1717 N Nagle Ave
- 1741 N Nagle Ave
- 1743 N Nagle Ave
- 1713 N Nagle Ave
- 1747 N Nagle Ave
- 1732 N Narragansett Ave
- 1722 N Narragansett Ave
- 1709 N Nagle Ave
- 1734 N Narragansett Ave
- 1749 N Nagle Ave
- 1716 N Narragansett Ave
- 1738 N Narragansett Ave
- 1726 N Narragansett Ave
- 1728 N Narragansett Ave