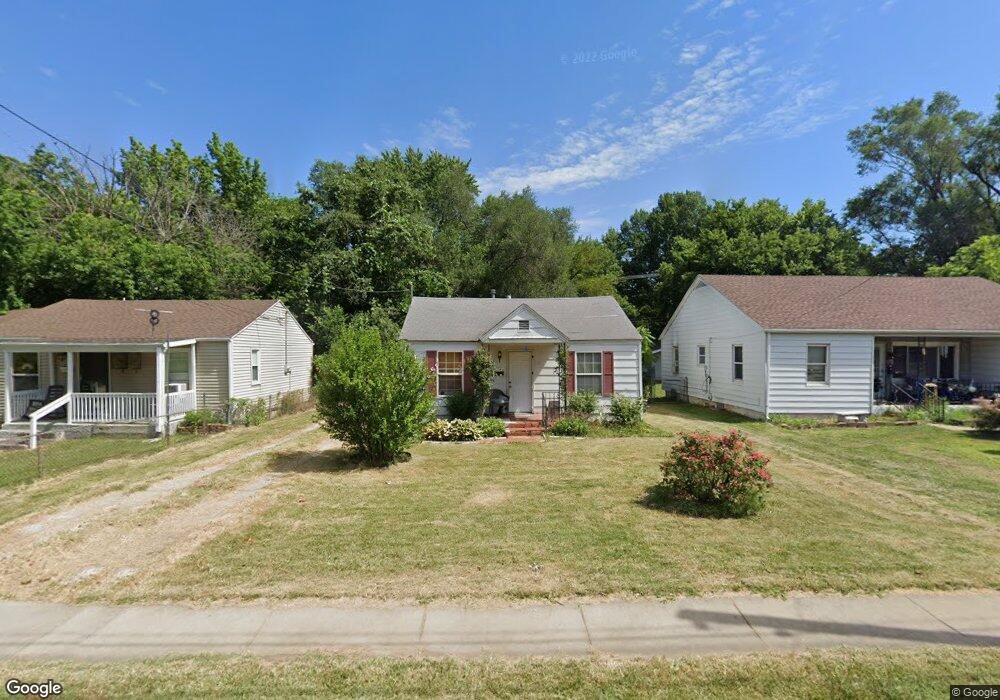
1729 W Nichols St Springfield, MO 65802
Heart of the Westside NeighborhoodEstimated Value: $78,078 - $193,000
3
Beds
1
Bath
600
Sq Ft
$194/Sq Ft
Est. Value
About This Home
This home is located at 1729 W Nichols St, Springfield, MO 65802 and is currently estimated at $116,520, approximately $194 per square foot. 1729 W Nichols St is a home located in Greene County with nearby schools including York Elementary School, Pipkin Middle School, and Central High School.
Ownership History
Date
Name
Owned For
Owner Type
Purchase Details
Closed on
Feb 21, 2014
Sold by
Moger Robert C and Moger Vera
Bought by
Finlin Kelly
Current Estimated Value
Purchase Details
Closed on
Mar 30, 2011
Sold by
Secretary Of Hud
Bought by
Moger Robert C
Purchase Details
Closed on
May 12, 2010
Sold by
Citimortgage Inc
Bought by
Secretary Of Hud
Purchase Details
Closed on
May 3, 2010
Sold by
Annis Michael W
Bought by
Citimortgage Inc
Purchase Details
Closed on
Sep 22, 2006
Sold by
Richards Stanley and Richards Kelly
Bought by
Annis Michael W and Annis Stacey M
Home Financials for this Owner
Home Financials are based on the most recent Mortgage that was taken out on this home.
Original Mortgage
$56,453
Interest Rate
6.47%
Mortgage Type
FHA
Purchase Details
Closed on
Mar 27, 2006
Sold by
Little Carolyn Vienhge
Bought by
Richards Stanley and Richards Kelly
Create a Home Valuation Report for This Property
The Home Valuation Report is an in-depth analysis detailing your home's value as well as a comparison with similar homes in the area
Home Values in the Area
Average Home Value in this Area
Purchase History
| Date | Buyer | Sale Price | Title Company |
|---|---|---|---|
| Finlin Kelly | -- | None Available | |
| Moger Robert C | -- | None Available | |
| Secretary Of Hud | -- | None Available | |
| Citimortgage Inc | $71,682 | None Available | |
| Annis Michael W | -- | None Available | |
| Richards Stanley | -- | None Available |
Source: Public Records
Mortgage History
| Date | Status | Borrower | Loan Amount |
|---|---|---|---|
| Previous Owner | Annis Michael W | $56,453 |
Source: Public Records
Tax History
| Year | Tax Paid | Tax Assessment Tax Assessment Total Assessment is a certain percentage of the fair market value that is determined by local assessors to be the total taxable value of land and additions on the property. | Land | Improvement |
|---|---|---|---|---|
| 2025 | $351 | $7,050 | $3,040 | $4,010 |
| 2024 | $284 | $5,300 | $1,900 | $3,400 |
| 2023 | $283 | $5,300 | $1,900 | $3,400 |
| 2022 | $292 | $5,340 | $1,900 | $3,440 |
| 2021 | $292 | $5,340 | $1,900 | $3,440 |
| 2020 | $299 | $5,240 | $1,900 | $3,340 |
| 2019 | $291 | $5,240 | $1,900 | $3,340 |
| 2018 | $310 | $5,590 | $1,900 | $3,690 |
| 2017 | $307 | $5,570 | $1,900 | $3,670 |
| 2016 | $305 | $5,570 | $1,900 | $3,670 |
| 2015 | $302 | $5,570 | $1,900 | $3,670 |
| 2014 | $304 | $5,550 | $1,900 | $3,650 |
Source: Public Records
Map
Nearby Homes
- 903 N Lexington Ave
- 1735 W Webster St
- 1711 W Webster St
- 1232 N Farmer Ave
- 1621 W Chestnut St
- 1816 W Chestnut St
- 827 N Marion Ave
- 2019 W Webster St
- 3220 W Chestnut St
- 1535 W Calhoun St
- 1321 N Wabash Ave
- 2106 W Webster St
- 714 N Kansas Expy
- 659 N Lafontaine Ave
- 1500 W Hamilton St
- 1521 W Hamilton St
- 622 N Lafontaine Ave
- 1520 W Lynn St
- 1327 N Marion Ave
- 1836 W Hovey St
- 1733 W Nichols St
- 1727 W Nichols St
- 1721 W Nichols St
- 1801 W Nichols St
- 1717 W Nichols St
- 1807 W Nichols St
- 1732 W Scott St
- 1738 W Scott St
- 1728 W Scott St
- 1711 W Nichols St
- 1811 W Nichols St
- 1720 W Nichols St
- 1724 W Scott St
- 1800 W Scott St
- 1716 W Nichols St
- 927 N Lexington Ave
- 1806 W Scott St
- 1705 W Nichols St
- 1710 W Nichols St
- 1817 W Nichols St
Your Personal Tour Guide
Ask me questions while you tour the home.