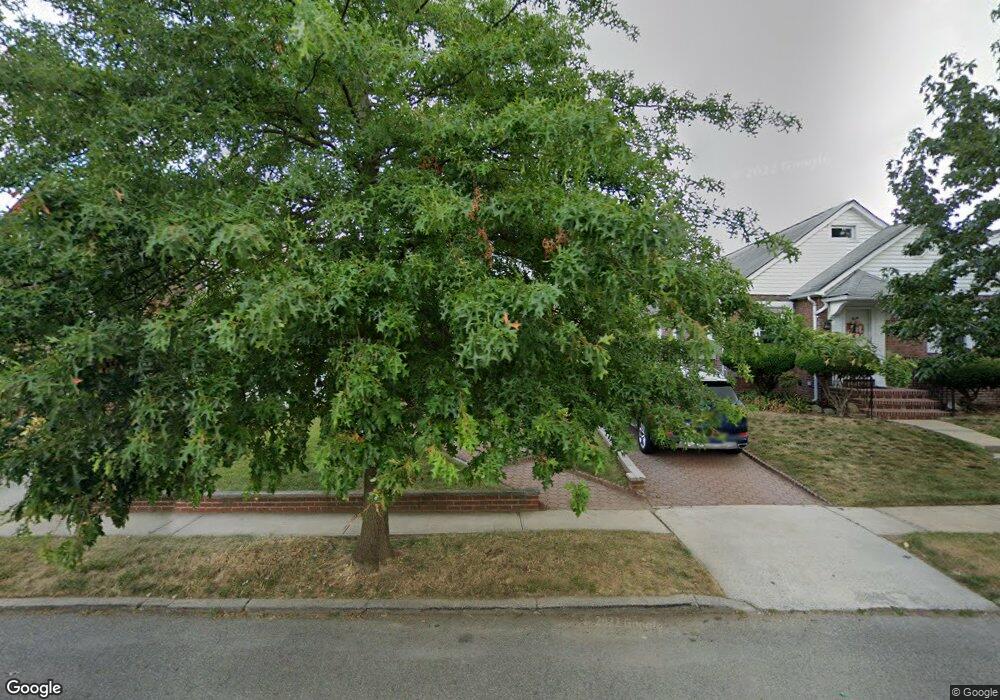
173-25 Effington Ave Flushing, NY 11358
Flushing NeighborhoodEstimated Value: $817,000 - $1,200,000
3
Beds
1
Bath
4,000
Sq Ft
$250/Sq Ft
Est. Value
About This Home
This home is located at 173-25 Effington Ave, Flushing, NY 11358 and is currently estimated at $999,390, approximately $249 per square foot. 173-25 Effington Ave is a home located in Queens County with nearby schools including P.S. 107 Thomas A Dooley, George J. Ryan Middle School 216, and Francis Lewis High School.
Ownership History
Date
Name
Owned For
Owner Type
Purchase Details
Closed on
Jan 22, 2025
Sold by
Arizmendy Maria C
Bought by
Arizmendy Maria C and Cruz Pedro
Current Estimated Value
Purchase Details
Closed on
Sep 27, 2000
Sold by
Guzman Maria Alejandra
Bought by
Arizmendy Maria C
Home Financials for this Owner
Home Financials are based on the most recent Mortgage that was taken out on this home.
Original Mortgage
$251,250
Outstanding Balance
$92,937
Interest Rate
8.12%
Estimated Equity
$906,453
Purchase Details
Closed on
Jul 23, 1998
Sold by
Jaimes Luis E and Jaimes Zaida Mendoza
Bought by
Guzman Maria Alejandra
Home Financials for this Owner
Home Financials are based on the most recent Mortgage that was taken out on this home.
Original Mortgage
$220,500
Interest Rate
9.62%
Create a Home Valuation Report for This Property
The Home Valuation Report is an in-depth analysis detailing your home's value as well as a comparison with similar homes in the area
Home Values in the Area
Average Home Value in this Area
Purchase History
| Date | Buyer | Sale Price | Title Company |
|---|---|---|---|
| Arizmendy Maria C | -- | -- | |
| Arizmendy Maria C | $360,000 | -- | |
| Arizmendy Maria C | $360,000 | -- | |
| Guzman Maria Alejandra | $245,000 | Commonwealth Land Title Ins | |
| Guzman Maria Alejandra | $245,000 | Commonwealth Land Title Ins |
Source: Public Records
Mortgage History
| Date | Status | Borrower | Loan Amount |
|---|---|---|---|
| Open | Arizmendy Maria C | $251,250 | |
| Closed | Arizmendy Maria C | $251,250 | |
| Previous Owner | Guzman Maria Alejandra | $220,500 |
Source: Public Records
Tax History Compared to Growth
Tax History
| Year | Tax Paid | Tax Assessment Tax Assessment Total Assessment is a certain percentage of the fair market value that is determined by local assessors to be the total taxable value of land and additions on the property. | Land | Improvement |
|---|---|---|---|---|
| 2025 | $8,549 | $43,316 | $14,963 | $28,353 |
| 2024 | $8,549 | $42,564 | $14,113 | $28,451 |
| 2023 | $8,117 | $40,415 | $14,808 | $25,607 |
| 2022 | $7,638 | $53,940 | $18,840 | $35,100 |
| 2021 | $7,601 | $54,120 | $18,840 | $35,280 |
| 2020 | $7,641 | $48,540 | $18,840 | $29,700 |
| 2019 | $7,420 | $52,680 | $18,840 | $33,840 |
| 2018 | $6,865 | $33,679 | $12,427 | $21,252 |
| 2017 | $6,500 | $31,886 | $13,439 | $18,447 |
| 2016 | $6,017 | $31,886 | $13,439 | $18,447 |
| 2015 | $3,628 | $30,081 | $16,251 | $13,830 |
| 2014 | $3,628 | $29,559 | $18,521 | $11,038 |
Source: Public Records
Map
Nearby Homes
- 171-02 Courtney Ave
- 173-02 Effington Ave
- 171-41 Courtney Ave
- 173-50 Fairchild Ave
- 173-16 Fairchild Ave
- 171-37 Bagley Ave
- 47-09 188th St
- 17446 Gladwin Ave
- 48-05 186th St
- 171-40 Pidgeon Meadow Rd
- 4620 190th St
- 4720 190th St
- 17021 Lithonia Ave
- 47-51 190th St
- 19005 48th Ave
- 4818 190th St
- 47-43 192nd St
- 4919 169th St
- 4747 192nd St
- 45-64 170th St
- 17325 Effington Ave
- 17329 Effington Ave
- 17321 Effington Ave
- 17333 Effington Ave
- 17317 Effington Ave
- 17328 47th Ave
- 17337 Effington Ave
- 17332 47th Ave
- 17324 47th Ave
- 17337 Effington Ave
- 17313 Effington Ave
- 17313 Effington Ave
- 17328 47th Ave
- 173-26 Effington Ave
- 17336 47th Ave
- 17320 47th Ave
- 17324 47th Ave
- 173-24 47th Ave
- 173-22 Effington Ave
- 173-40 47th Ave