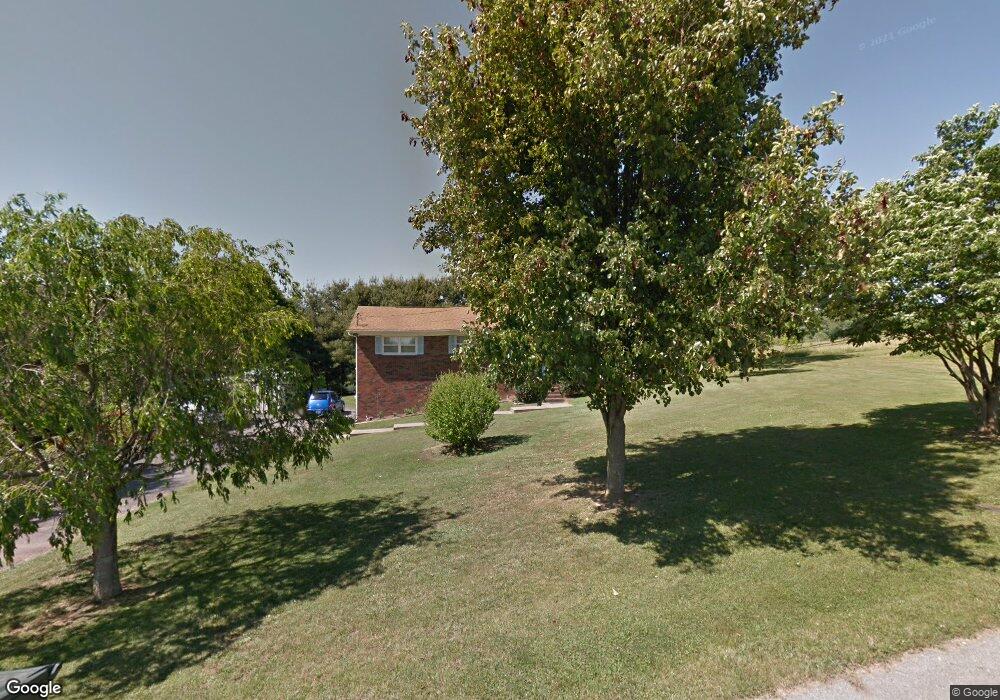
173 Bob Hays Rd Jonesborough, TN 37659
Estimated Value: $357,729 - $483,000
--
Bed
2
Baths
1,537
Sq Ft
$263/Sq Ft
Est. Value
About This Home
This home is located at 173 Bob Hays Rd, Jonesborough, TN 37659 and is currently estimated at $403,932, approximately $262 per square foot. 173 Bob Hays Rd is a home located in Washington County with nearby schools including Boones Creek Elementary School, Boones Creek Middle School, and Daniel Boone High School.
Ownership History
Date
Name
Owned For
Owner Type
Purchase Details
Closed on
Sep 26, 2024
Sold by
Jones-Light Robin Denise
Bought by
Quesinberry Brandi Hollifield
Current Estimated Value
Purchase Details
Closed on
Jun 9, 2014
Sold by
Dye James and Dye Shirley E
Bought by
Dye Shirley E L and Dye Rem E
Purchase Details
Closed on
Apr 10, 1980
Bought by
Dye James and Dye Shirley E
Create a Home Valuation Report for This Property
The Home Valuation Report is an in-depth analysis detailing your home's value as well as a comparison with similar homes in the area
Home Values in the Area
Average Home Value in this Area
Purchase History
| Date | Buyer | Sale Price | Title Company |
|---|---|---|---|
| Quesinberry Brandi Hollifield | -- | None Listed On Document | |
| Quesinberry Brandi Hollifield | -- | None Listed On Document | |
| Dye Shirley E L | -- | -- | |
| Dye James | $3,000 | -- |
Source: Public Records
Tax History Compared to Growth
Tax History
| Year | Tax Paid | Tax Assessment Tax Assessment Total Assessment is a certain percentage of the fair market value that is determined by local assessors to be the total taxable value of land and additions on the property. | Land | Improvement |
|---|---|---|---|---|
| 2024 | $1,362 | $79,625 | $12,050 | $67,575 |
| 2023 | $1,037 | $48,250 | $0 | $0 |
| 2022 | $1,037 | $48,250 | $9,650 | $38,600 |
| 2021 | $1,037 | $48,250 | $9,650 | $38,600 |
| 2020 | $1,040 | $48,250 | $9,650 | $38,600 |
| 2019 | $1,030 | $48,375 | $9,650 | $38,725 |
| 2018 | $1,030 | $43,300 | $9,650 | $33,650 |
| 2017 | $1,030 | $43,300 | $9,650 | $33,650 |
| 2016 | $1,030 | $43,300 | $9,650 | $33,650 |
| 2015 | $857 | $43,300 | $9,650 | $33,650 |
| 2014 | $857 | $43,300 | $9,650 | $33,650 |
Source: Public Records
Map
Nearby Homes
- 105 Black Thorn Dr
- 219 Lake Ridge Dr
- 112 Black Thorn Dr
- 1093 Hawk Nest Ct
- 405 Heather View Dr
- 610 Magnolia Ridge Dr
- 1604 Boones Creek Rd
- 141 Laurel Ridge Dr
- 114 Highland Gate Dr
- 607 Live Oak Ct
- 1839 Villa Ct
- 211 Michaels Ridge Blvd
- 220 Michaels Ridge Blvd
- 168 Laurel Ridge Dr
- 235 Winston Place
- 246 Winston Place
- 1239 Olde Oaks Dr
- 472 Gransley Ct
- 111 Station Way
- 19 Station Way
- 167 Bob Hays Rd
- 207 Bob Hays Rd
- 207 Bob Hays Rd
- 129 Bob Hays Rd
- 4 Bent Tree Ct
- 128 Magnolia Ridge Dr
- 122 Magnolia Ridge Dr
- 134 Magnolia Ridge Dr
- 116 Magnolia Ridge Dr
- 140 Magnolia Ridge Dr
- 5 Bent Tree Ct
- 71 Cypress Ridge Ct
- 77 Cypress Ridge Ct
- 110 Magnolia Ridge Dr
- 89 Cypress Ridge Ct
- 65 Cypress Ridge Ct
- 104 Magnolia Ridge Dr
- 131 Magnolia Ridge Dr
- 53 Cypress Ridge Ct
- 1 Bent Tree Ct