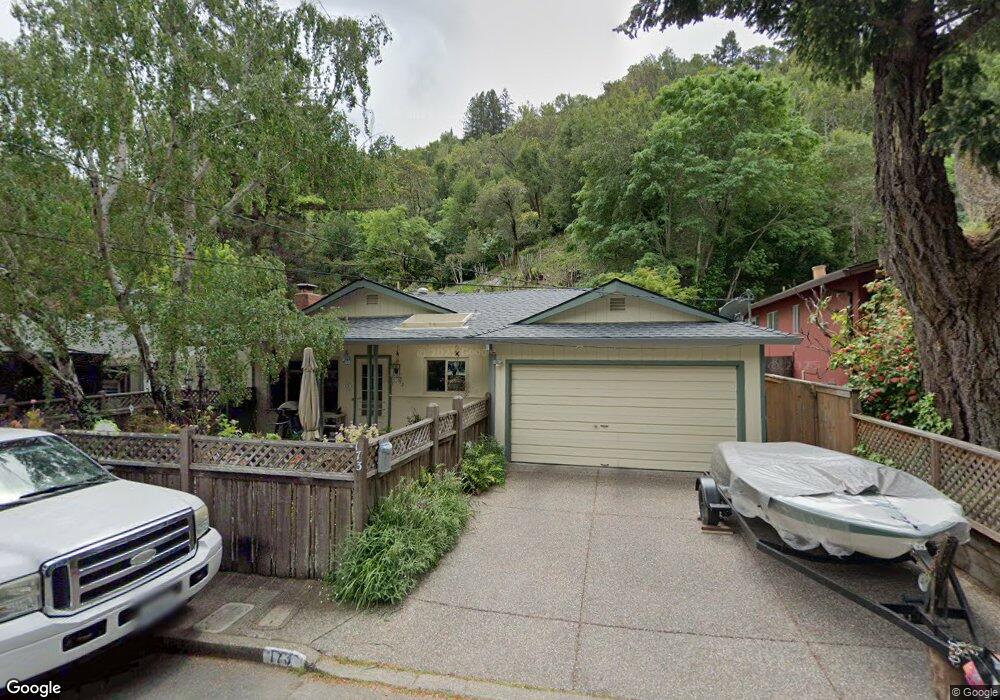
173 Bothin Rd Fairfax, CA 94930
Estimated Value: $763,471 - $1,112,000
3
Beds
1
Bath
1,125
Sq Ft
$842/Sq Ft
Est. Value
About This Home
This home is located at 173 Bothin Rd, Fairfax, CA 94930 and is currently estimated at $947,118, approximately $841 per square foot. 173 Bothin Rd is a home located in Marin County with nearby schools including Manor Elementary School, White Hill Middle School, and Archie Williams High School.
Ownership History
Date
Name
Owned For
Owner Type
Purchase Details
Closed on
Dec 31, 2015
Sold by
Schlee Schlee Mary Kay Mary Kay
Bought by
Schlee Schlee Mary Kay Mary Kay
Current Estimated Value
Home Financials for this Owner
Home Financials are based on the most recent Mortgage that was taken out on this home.
Original Mortgage
$938,250
Interest Rate
3.94%
Mortgage Type
Reverse Mortgage Home Equity Conversion Mortgage
Purchase Details
Closed on
Dec 3, 2002
Sold by
Schlee Darrell R and Schlee Mary K
Bought by
Schlee Darrell R and Schlee Mary Kay
Create a Home Valuation Report for This Property
The Home Valuation Report is an in-depth analysis detailing your home's value as well as a comparison with similar homes in the area
Home Values in the Area
Average Home Value in this Area
Purchase History
| Date | Buyer | Sale Price | Title Company |
|---|---|---|---|
| Schlee Schlee Mary Kay Mary Kay | -- | Placer Title Company | |
| Schlee Darrell R | -- | -- |
Source: Public Records
Mortgage History
| Date | Status | Borrower | Loan Amount |
|---|---|---|---|
| Closed | Schlee Schlee Mary Kay Mary Kay | $938,250 |
Source: Public Records
Tax History
| Year | Tax Paid | Tax Assessment Tax Assessment Total Assessment is a certain percentage of the fair market value that is determined by local assessors to be the total taxable value of land and additions on the property. | Land | Improvement |
|---|---|---|---|---|
| 2025 | $3,209 | $102,342 | $31,864 | $70,478 |
| 2024 | $3,104 | $100,335 | $31,239 | $69,096 |
| 2023 | $3,058 | $98,368 | $30,627 | $67,741 |
| 2022 | $2,542 | $96,439 | $30,026 | $66,413 |
| 2021 | $2,876 | $94,549 | $29,438 | $65,111 |
| 2020 | $2,684 | $93,560 | $29,127 | $64,433 |
| 2019 | $2,591 | $91,726 | $28,556 | $63,170 |
| 2018 | $2,521 | $89,927 | $27,996 | $61,931 |
| 2017 | $2,441 | $88,164 | $27,447 | $60,717 |
| 2016 | $2,316 | $86,436 | $26,909 | $59,527 |
| 2015 | $2,259 | $85,138 | $26,505 | $58,633 |
| 2014 | $2,066 | $83,470 | $25,986 | $57,484 |
Source: Public Records
Map
Nearby Homes
- 338 Olema Rd
- 223 Tamalpais Rd
- 51 Berry Trail
- 615 Oak Manor Dr
- 55 Park Rd
- 148 Ridgeway Ave
- 0 Cypress Dr
- 0 Valley Rd Unit 325089584
- 572 Cascade Dr
- 6 Hunter Creek
- 50 Hillcrest Ct
- 16 Dutch Valley Ln
- 2 Baytree Ln
- 327 Butterfield Rd
- 135 Morningside Dr
- 405 Scenic Ave
- 418 Scenic Ave
- 1508 San Anselmo Ave
- 20 Brookmont Cir
- 480 Scenic Ave
Your Personal Tour Guide
Ask me questions while you tour the home.