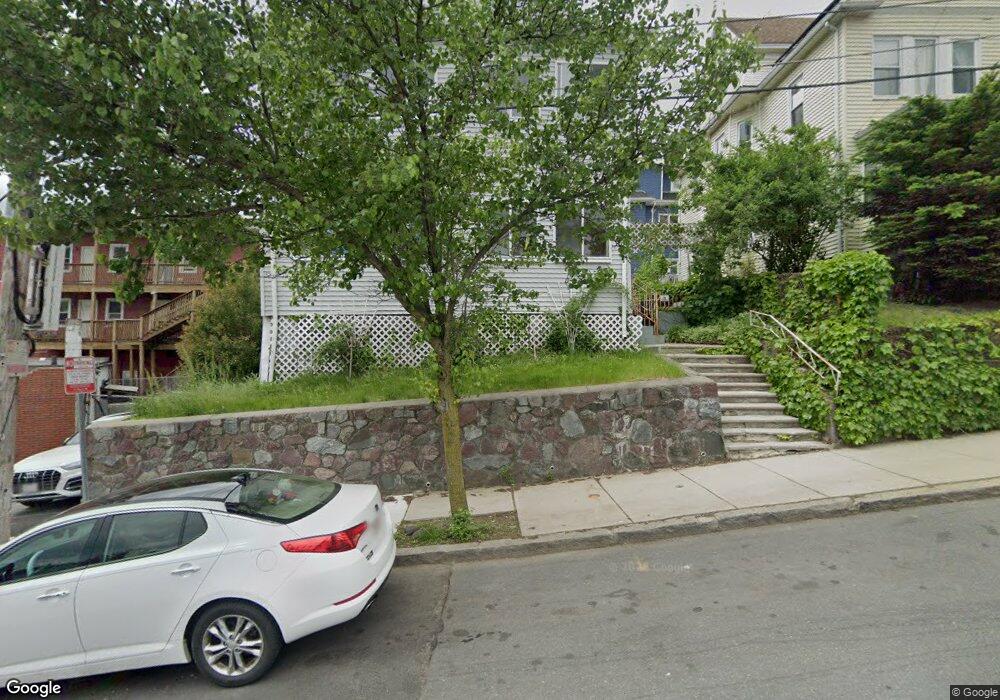
173 Chestnut St Everett, MA 02149
Glendale NeighborhoodEstimated Value: $825,206 - $942,000
4
Beds
2
Baths
2,406
Sq Ft
$366/Sq Ft
Est. Value
About This Home
This home is located at 173 Chestnut St, Everett, MA 02149 and is currently estimated at $879,552, approximately $365 per square foot. 173 Chestnut St is a home located in Middlesex County with nearby schools including Everett High School and Pioneer Charter School of Science.
Ownership History
Date
Name
Owned For
Owner Type
Purchase Details
Closed on
May 1, 1996
Sold by
Pagliuca Anthony P and Pagliuca Kathy H
Bought by
Henley Patricia A
Current Estimated Value
Home Financials for this Owner
Home Financials are based on the most recent Mortgage that was taken out on this home.
Original Mortgage
$120,300
Outstanding Balance
$6,742
Interest Rate
7.82%
Mortgage Type
Purchase Money Mortgage
Estimated Equity
$872,810
Create a Home Valuation Report for This Property
The Home Valuation Report is an in-depth analysis detailing your home's value as well as a comparison with similar homes in the area
Home Values in the Area
Average Home Value in this Area
Purchase History
| Date | Buyer | Sale Price | Title Company |
|---|---|---|---|
| Henley Patricia A | $126,700 | -- |
Source: Public Records
Mortgage History
| Date | Status | Borrower | Loan Amount |
|---|---|---|---|
| Open | Henley Patricia A | $120,300 |
Source: Public Records
Tax History
| Year | Tax Paid | Tax Assessment Tax Assessment Total Assessment is a certain percentage of the fair market value that is determined by local assessors to be the total taxable value of land and additions on the property. | Land | Improvement |
|---|---|---|---|---|
| 2025 | $8,765 | $769,500 | $249,300 | $520,200 |
| 2024 | $8,024 | $700,200 | $221,600 | $478,600 |
| 2023 | $7,719 | $655,300 | $203,100 | $452,200 |
| 2022 | $6,337 | $611,700 | $193,900 | $417,800 |
| 2021 | $5,676 | $575,100 | $173,600 | $401,500 |
| 2020 | $5,969 | $561,000 | $173,600 | $387,400 |
| 2019 | $6,309 | $509,600 | $165,300 | $344,300 |
| 2018 | $6,171 | $447,800 | $144,000 | $303,800 |
| 2017 | $5,613 | $388,700 | $110,800 | $277,900 |
| 2016 | $5,188 | $359,000 | $110,800 | $248,200 |
| 2015 | $4,905 | $335,700 | $104,100 | $231,600 |
Source: Public Records
Map
Nearby Homes
- 110 Ferry St
- 20 Fairmount St
- 55 Garland St
- 99 Florence St
- 21 Hillside Ave Unit 21
- 114 Francis St
- 88 Garland St
- 20 Ferry St Unit B
- 181 Chelsea St
- 238 Chelsea St
- 138 Fremont Ave
- 378 Ferry St
- 27 Silver Rd
- 211 Elm St
- 62 Madison Ave
- 51 Adams Ave
- 132 Vernal St
- 101 Springvale Ave
- 15 Staples Ave Unit 45
- 15 Staples Ave Unit 31
- 169 Chestnut St
- 171 Chestnut St
- 2 Magnolia Ct
- 180 Ferry St
- 178 Ferry St Unit 2
- 174 Ferry St Unit 1
- 174 Ferry St Unit 1f
- 174 Ferry St
- 4 Magnolia Ct
- 1 Magnolia Ct
- 3 Magnolia Ct Unit 2
- 3 Magnolia Ct
- 172 Ferry St
- 5 Magnolia Ct
- 168 Chestnut St
- 179 Ferry St
- 181 Ferry St
- 181 Ferry St Unit 1
- 17 Pleasant View Ave
- 19 Pleasant View Ave
Your Personal Tour Guide
Ask me questions while you tour the home.