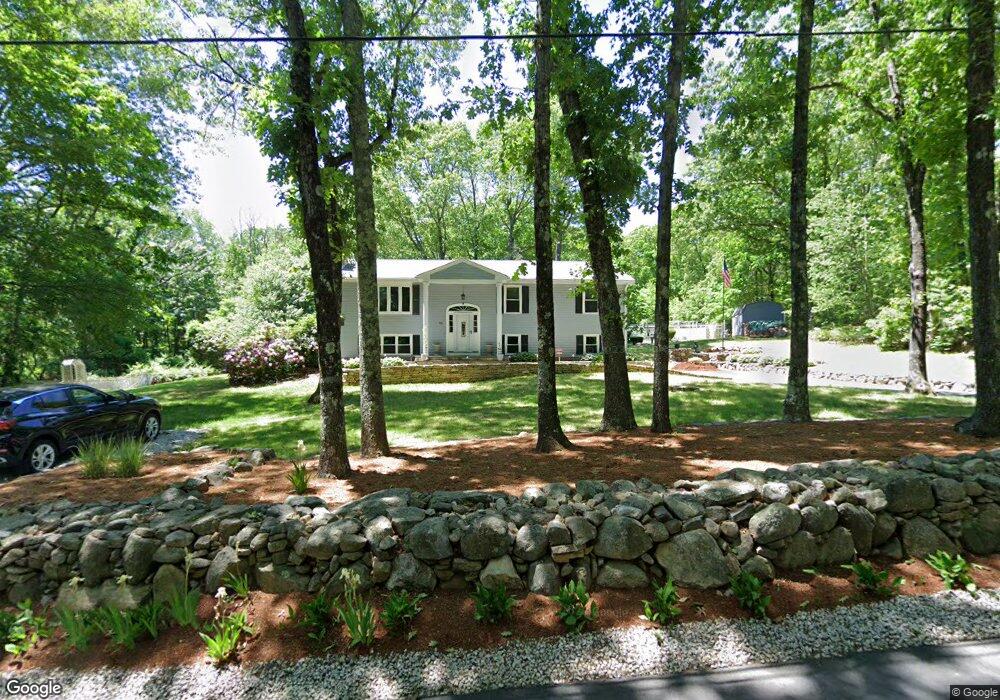
173 Chestnut St Uxbridge, MA 01569
Estimated Value: $549,000 - $619,000
3
Beds
2
Baths
2,436
Sq Ft
$244/Sq Ft
Est. Value
About This Home
This home is located at 173 Chestnut St, Uxbridge, MA 01569 and is currently estimated at $593,724, approximately $243 per square foot. 173 Chestnut St is a home located in Worcester County with nearby schools including Uxbridge High School and Our Lady of the Valley Regional School.
Ownership History
Date
Name
Owned For
Owner Type
Purchase Details
Closed on
Jun 30, 1992
Sold by
Roberge Richard and Robergs Amy M
Bought by
Aufiero Paul J and Kelly Barbara A
Current Estimated Value
Home Financials for this Owner
Home Financials are based on the most recent Mortgage that was taken out on this home.
Original Mortgage
$100,000
Interest Rate
8.57%
Mortgage Type
Purchase Money Mortgage
Create a Home Valuation Report for This Property
The Home Valuation Report is an in-depth analysis detailing your home's value as well as a comparison with similar homes in the area
Home Values in the Area
Average Home Value in this Area
Purchase History
| Date | Buyer | Sale Price | Title Company |
|---|---|---|---|
| Aufiero Paul J | $128,900 | -- |
Source: Public Records
Mortgage History
| Date | Status | Borrower | Loan Amount |
|---|---|---|---|
| Open | Aufiero Paul J | $100,000 | |
| Closed | Aufiero Paul J | $100,000 |
Source: Public Records
Tax History
| Year | Tax Paid | Tax Assessment Tax Assessment Total Assessment is a certain percentage of the fair market value that is determined by local assessors to be the total taxable value of land and additions on the property. | Land | Improvement |
|---|---|---|---|---|
| 2025 | $60 | $460,500 | $168,700 | $291,800 |
| 2024 | $5,837 | $451,800 | $160,000 | $291,800 |
| 2023 | $5,584 | $400,300 | $138,400 | $261,900 |
| 2022 | $5,468 | $360,700 | $121,100 | $239,600 |
| 2021 | $5,540 | $350,200 | $118,500 | $231,700 |
| 2020 | $5,174 | $309,100 | $116,800 | $192,300 |
| 2019 | $5,302 | $305,600 | $116,800 | $188,800 |
| 2018 | $4,984 | $290,300 | $116,800 | $173,500 |
| 2017 | $5,185 | $305,700 | $107,500 | $198,200 |
| 2016 | $5,146 | $292,900 | $102,100 | $190,800 |
| 2015 | $4,990 | $286,800 | $102,100 | $184,700 |
Source: Public Records
Map
Nearby Homes
- 57 Chestnut St
- 70 Chocolog Rd
- 342 Chestnut St
- 15 Turner Farm Rd
- 12 Turner Farm Rd
- 18 Turner Farm Rd
- 30 Chocolog Rd
- 45 Turner Farm Rd
- 46 Turner Farm Rd
- 47 Turner Farm Rd
- 114 Turner Farm Rd
- 126 Turner Farm Rd
- 136 Turner Farm Rd
- 145 Turner Farm Rd
- 127 Turner Farm Rd
- 139 Turner Farm Rd
- 29 Glendale St
- 314 Richardson St
- 127 Old Millville Rd
- 197 Crownshield Ave Unit 16B
Your Personal Tour Guide
Ask me questions while you tour the home.