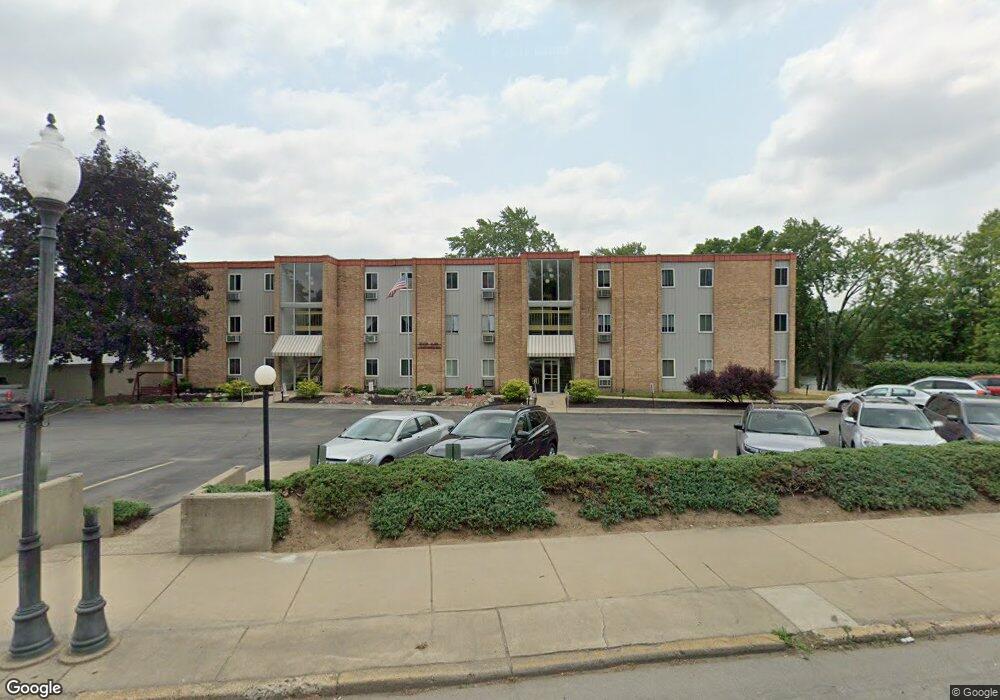
173 E Michigan Ave Unit 204B Three Rivers, MI 49093
Estimated Value: $71,000 - $110,062
2
Beds
2
Baths
915
Sq Ft
$94/Sq Ft
Est. Value
About This Home
This home is located at 173 E Michigan Ave Unit 204B, Three Rivers, MI 49093 and is currently estimated at $86,016, approximately $94 per square foot. 173 E Michigan Ave Unit 204B is a home located in St. Joseph County with nearby schools including Immaculate Conception School and Heartwood Renaissance Academy.
Ownership History
Date
Name
Owned For
Owner Type
Purchase Details
Closed on
Dec 10, 2011
Sold by
Replogle Dennis R and Replogle Douglas A
Bought by
Taylor Nadine
Current Estimated Value
Purchase Details
Closed on
May 29, 2011
Sold by
Replogle Raymond and Replogle Dennis
Bought by
Replogle Dennis and Replogle Douglas
Purchase Details
Closed on
Oct 12, 2007
Sold by
Replogle Raymond J
Bought by
Replogle Raymond J and Replogle Dennis R
Purchase Details
Closed on
Mar 23, 2005
Sold by
Replogle Raymond J
Bought by
Replogle Raymond J
Purchase Details
Closed on
Oct 28, 1998
Sold by
Replogle Raymond J and Replogle Elanore M
Bought by
Replogle Raymond & M Elanore- Trust
Purchase Details
Closed on
Mar 19, 1998
Sold by
Hackenberg Roy & Geraldine - Trust
Bought by
Replogle Raymond J and Replogle Elanore M
Purchase Details
Closed on
Aug 24, 1992
Sold by
Hackenberg Roy and Trusts Geraldine -
Bought by
Replogle Raymond J and Replogle Eleanore M
Create a Home Valuation Report for This Property
The Home Valuation Report is an in-depth analysis detailing your home's value as well as a comparison with similar homes in the area
Home Values in the Area
Average Home Value in this Area
Purchase History
| Date | Buyer | Sale Price | Title Company |
|---|---|---|---|
| Taylor Nadine | $34,000 | Patrick Abstract | |
| Replogle Dennis | -- | -- | |
| Replogle Raymond J | -- | None Available | |
| Replogle Raymond J | -- | -- | |
| Replogle Raymond & M Elanore- Trust | -- | -- | |
| Replogle Raymond J | $40,000 | -- | |
| Replogle Raymond J | -- | -- |
Source: Public Records
Tax History Compared to Growth
Tax History
| Year | Tax Paid | Tax Assessment Tax Assessment Total Assessment is a certain percentage of the fair market value that is determined by local assessors to be the total taxable value of land and additions on the property. | Land | Improvement |
|---|---|---|---|---|
| 2025 | $1,059 | $41,300 | $5,000 | $36,300 |
| 2024 | $712 | $40,100 | $4,400 | $35,700 |
| 2023 | $678 | $32,200 | $3,800 | $28,400 |
| 2022 | $646 | $27,300 | $2,500 | $24,800 |
| 2021 | $932 | $25,800 | $2,300 | $23,500 |
| 2020 | $920 | $22,700 | $1,600 | $21,100 |
| 2019 | $903 | $20,600 | $2,000 | $18,600 |
| 2018 | $858 | $21,400 | $1,100 | $20,300 |
| 2017 | $845 | $22,000 | $22,000 | $0 |
| 2016 | -- | $21,600 | $21,600 | $0 |
| 2015 | -- | $21,700 | $0 | $0 |
| 2014 | -- | $21,400 | $21,400 | $0 |
| 2012 | -- | $23,900 | $0 | $0 |
Source: Public Records
Map
Nearby Homes
- 173 E Michigan Ave Unit 311A
- 173 E Michigan Ave Unit 310A
- 173 E Michigan Ave Unit 309A
- 173 E Michigan Ave Unit 308A
- 173 E Michigan Ave Unit 307A
- 173 E Michigan Ave Unit 306A
- 173 E Michigan Ave Unit 305B
- 173 E Michigan Ave Unit 304B
- 173 E Michigan Ave Unit 302B
- 173 E Michigan Ave Unit 301B
- 173 E Michigan Ave Unit 211A
- 173 E Michigan Ave Unit 209A
- 173 E Michigan Ave Unit 210A
- 173 E Michigan Ave Unit 207A
- 173 E Michigan Ave Unit 208A
- 173 E Michigan Ave Unit 205B
- 173 E Michigan Ave Unit 206A
- 173 E Michigan Ave Unit 203B
- 173 E Michigan Ave Unit 201B
- 173 E Michigan Ave Unit 202B