Estimated Value: $541,000 - $570,000
3
Beds
3
Baths
2,340
Sq Ft
$236/Sq Ft
Est. Value
About This Home
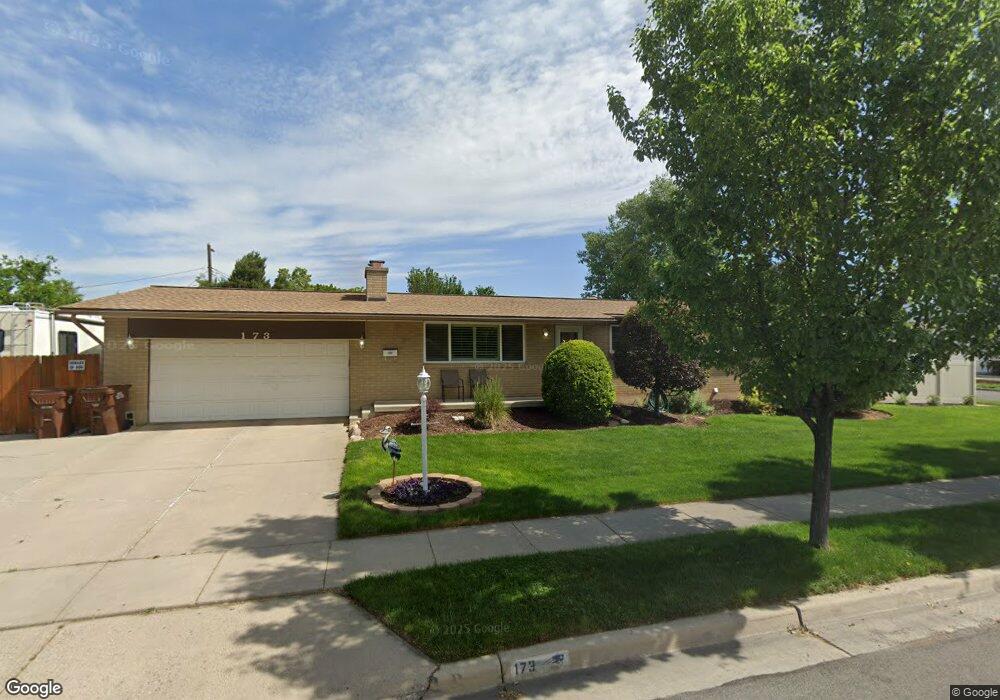
This home is located at 173 E Tennyson Ave, Sandy, UT 84070 and is currently estimated at $553,318, approximately $236 per square foot. 173 E Tennyson Ave is a home located in Salt Lake County with nearby schools including Midvalley Elementary School, Union Middle School, and Hillcrest High School.
Ownership History
Date
Name
Owned For
Owner Type
Purchase Details
Closed on
Jun 23, 2012
Sold by
Rich Ashly D and Rich Ashley D
Bought by
Rich Ashly D and Magnuson Steven A
Current Estimated Value
Purchase Details
Closed on
Oct 25, 2011
Sold by
Parcell Carolee M
Bought by
Rich Ashley D and Magnuson Steven R
Home Financials for this Owner
Home Financials are based on the most recent Mortgage that was taken out on this home.
Original Mortgage
$175,339
Interest Rate
3.75%
Mortgage Type
FHA
Create a Home Valuation Report for This Property
The Home Valuation Report is an in-depth analysis detailing your home's value as well as a comparison with similar homes in the area
Home Values in the Area
Average Home Value in this Area
Purchase History
| Date | Buyer | Sale Price | Title Company |
|---|---|---|---|
| Rich Ashly D | -- | Inwest Title Services | |
| Rich Ashley D | -- | Inwest Title Services |
Source: Public Records
Mortgage History
| Date | Status | Borrower | Loan Amount |
|---|---|---|---|
| Previous Owner | Rich Ashley D | $175,339 |
Source: Public Records
Tax History
| Year | Tax Paid | Tax Assessment Tax Assessment Total Assessment is a certain percentage of the fair market value that is determined by local assessors to be the total taxable value of land and additions on the property. | Land | Improvement |
|---|---|---|---|---|
| 2025 | $3,053 | $508,700 | $130,600 | $378,100 |
| 2024 | $3,053 | $501,200 | $122,800 | $378,400 |
| 2023 | $2,663 | $433,200 | $116,700 | $316,500 |
| 2022 | $2,806 | $445,900 | $114,400 | $331,500 |
| 2021 | $2,504 | $340,200 | $99,500 | $240,700 |
| 2020 | $2,381 | $306,200 | $80,600 | $225,600 |
| 2019 | $2,291 | $287,000 | $80,600 | $206,400 |
| 2016 | $1,917 | $226,400 | $71,600 | $154,800 |
Source: Public Records
Map
Nearby Homes
- 190 E White Spruce Cove Unit 805
- 135 E Station St
- 7824 S 280 E
- 257 E Water Mill Way
- 257 Water Mill Way Unit 211
- 274 E Water Mill Way Unit 230
- 379 E Horse Creek Dr
- 393 E Corral Creek Dr
- 397 E Tractor Dr Unit 103
- 116 E Resaca Dr Unit F2
- 8229 S Resaca Dr Unit D3
- 90 E Resaca Dr Unit C11
- 8264 S Resaca Dr Unit K9
- 74 E Resaca Dr Unit B12
- 7359 S Dewmar Ct W Unit 32
- 489 E 7800 S Unit 2
- 7363 S Dewmar Ct W Unit 33
- 7342 S Seven Tree Ln W Unit 77
- 7329 S Seven Tree Ln W Unit 85
- 7371 S Dewmar Ct W Unit 35
- 173 Tennyson Ave
- 7910 S 180 E
- 7915 Millerberg Dr
- 7905 Millerberg Dr
- 7905 S Millerberg Dr
- 176 E 7930 S
- 176 Tennyson Ave
- 168 Tennyson Ave
- 7900 S 180 E
- 160 E Tennyson Ave
- 160 Tennyson Ave
- 160 E 7930 S
- 7891 Millerberg Dr
- 186 E 7930 S
- 186 Tennyson Ave
- 7909 S 180 E
- 189 Tennyson Ave
- 154 Tennyson Ave
- 7879 Millerberg Dr
- 193 E 8000 S
Your Personal Tour Guide
Ask me questions while you tour the home.