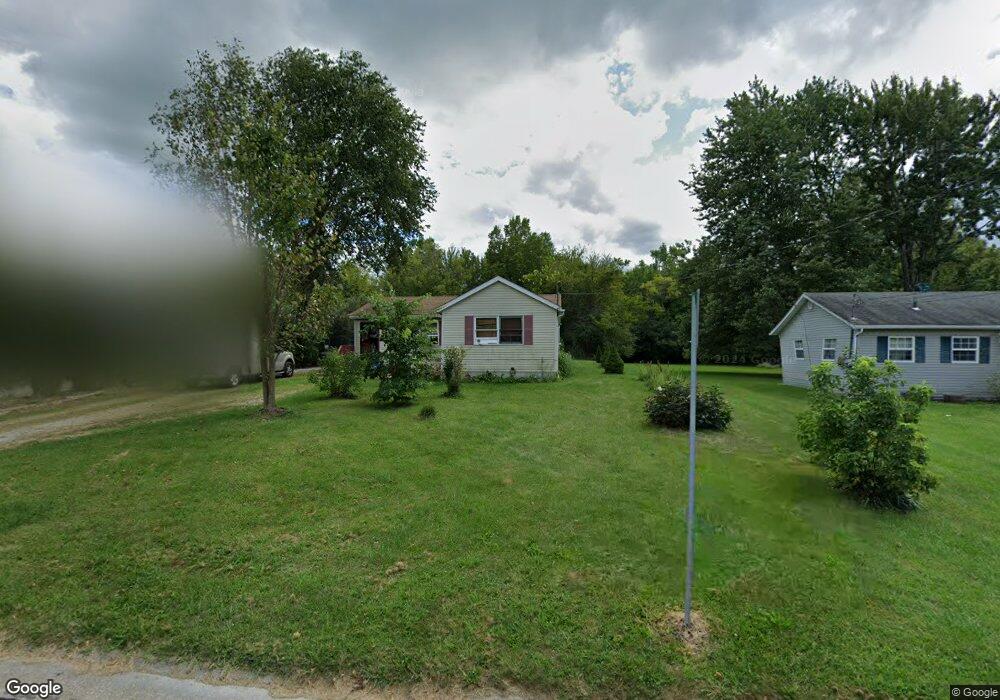
173 Grafton St Oberlin, OH 44074
Estimated Value: $148,000 - $202,000
3
Beds
1
Bath
1,008
Sq Ft
$163/Sq Ft
Est. Value
About This Home
This home is located at 173 Grafton St, Oberlin, OH 44074 and is currently estimated at $164,653, approximately $163 per square foot. 173 Grafton St is a home located in Lorain County with nearby schools including Oberlin Elementary School, Prospect Elementary School, and Langston Middle School.
Ownership History
Date
Name
Owned For
Owner Type
Purchase Details
Closed on
Mar 15, 2004
Sold by
Mortgage Electronic Registration Systems
Bought by
Pfenninger Ronald L and Pfenninger Dena L
Current Estimated Value
Home Financials for this Owner
Home Financials are based on the most recent Mortgage that was taken out on this home.
Original Mortgage
$81,403
Outstanding Balance
$37,591
Interest Rate
5.5%
Mortgage Type
FHA
Estimated Equity
$127,062
Purchase Details
Closed on
Sep 16, 2003
Sold by
Bohles Pamela R and Bohles Darryl
Bought by
Mortgage Electronic Registration Systems and Household Finance Corp
Purchase Details
Closed on
Jul 20, 2000
Sold by
Maben Pamela R and Maben Pamela R
Bought by
Bohles Darryl L and Bohles Pamela R
Home Financials for this Owner
Home Financials are based on the most recent Mortgage that was taken out on this home.
Original Mortgage
$118,000
Interest Rate
11.11%
Create a Home Valuation Report for This Property
The Home Valuation Report is an in-depth analysis detailing your home's value as well as a comparison with similar homes in the area
Home Values in the Area
Average Home Value in this Area
Purchase History
| Date | Buyer | Sale Price | Title Company |
|---|---|---|---|
| Pfenninger Ronald L | $85,000 | -- | |
| Mortgage Electronic Registration Systems | $60,000 | -- | |
| Bohles Darryl L | -- | Chelsea Title Agency |
Source: Public Records
Mortgage History
| Date | Status | Borrower | Loan Amount |
|---|---|---|---|
| Open | Pfenninger Ronald L | $81,403 | |
| Previous Owner | Bohles Darryl L | $118,000 |
Source: Public Records
Tax History Compared to Growth
Tax History
| Year | Tax Paid | Tax Assessment Tax Assessment Total Assessment is a certain percentage of the fair market value that is determined by local assessors to be the total taxable value of land and additions on the property. | Land | Improvement |
|---|---|---|---|---|
| 2024 | $2,151 | $42,893 | $9,205 | $33,688 |
| 2023 | $1,667 | $29,607 | $5,100 | $24,507 |
| 2022 | $1,624 | $29,607 | $5,100 | $24,507 |
| 2021 | $1,618 | $29,607 | $5,100 | $24,507 |
| 2020 | $1,506 | $25,950 | $4,470 | $21,480 |
| 2019 | $1,482 | $25,950 | $4,470 | $21,480 |
| 2018 | $1,491 | $25,950 | $4,470 | $21,480 |
| 2017 | $1,486 | $27,080 | $3,930 | $23,150 |
| 2016 | $1,501 | $27,080 | $3,930 | $23,150 |
| 2015 | $1,503 | $27,080 | $3,930 | $23,150 |
| 2014 | $1,453 | $25,550 | $3,710 | $21,840 |
| 2013 | $1,428 | $25,550 | $3,710 | $21,840 |
Source: Public Records
Map
Nearby Homes
- 359 S Pleasant St
- 62 Locust St
- 182 E Hamilton St
- 360 S Main St
- 83 S Pleasant St
- 63 Spring St
- 110 Shipherd Cir
- 44 W Vine St
- 95 Shipherd Cir
- 81 S Professor St
- 147 Morgan St
- 149 Morgan St
- 111 N Pleasant St
- 263 W Lincoln St
- 396 Reserve Ave
- 257 Morgan St
- 246 W Hamilton St
- 235 Elm St
- 232 Elm St
- 216 N Main St