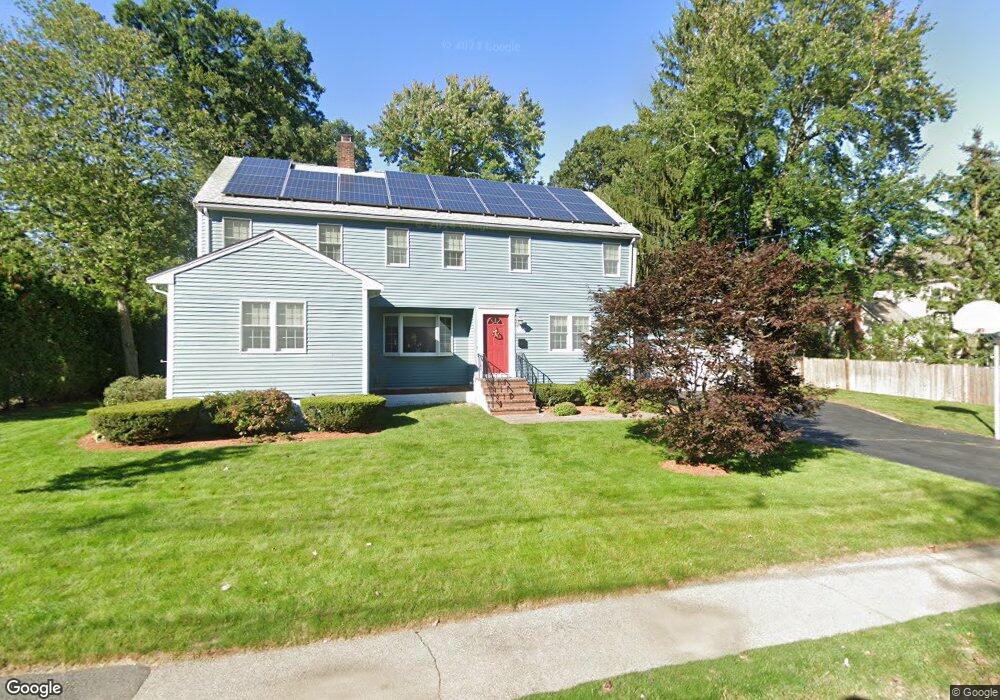
173 Highgate St Needham, MA 02492
Estimated Value: $1,307,000 - $1,572,000
4
Beds
3
Baths
1,116
Sq Ft
$1,273/Sq Ft
Est. Value
About This Home
This home is located at 173 Highgate St, Needham, MA 02492 and is currently estimated at $1,421,006, approximately $1,273 per square foot. 173 Highgate St is a home located in Norfolk County with nearby schools including Broadmeadow Elementary School, High Rock Middle School, and Pollard Middle School.
Ownership History
Date
Name
Owned For
Owner Type
Purchase Details
Closed on
Aug 31, 1995
Sold by
Carmichael Robert F and Carmichael Donna M
Bought by
Bezreh Nicholas M and Bezreh Carol A
Current Estimated Value
Home Financials for this Owner
Home Financials are based on the most recent Mortgage that was taken out on this home.
Original Mortgage
$130,000
Interest Rate
7.61%
Mortgage Type
Purchase Money Mortgage
Purchase Details
Closed on
Jul 6, 1992
Sold by
Flanagan Marjorie J
Bought by
Carmichael Robert F and Carmichael Donna M
Create a Home Valuation Report for This Property
The Home Valuation Report is an in-depth analysis detailing your home's value as well as a comparison with similar homes in the area
Home Values in the Area
Average Home Value in this Area
Purchase History
| Date | Buyer | Sale Price | Title Company |
|---|---|---|---|
| Bezreh Nicholas M | $352,500 | -- | |
| Bezreh Nicholas M | $352,500 | -- | |
| Carmichael Robert F | $200,500 | -- | |
| Carmichael Robert F | $200,500 | -- |
Source: Public Records
Mortgage History
| Date | Status | Borrower | Loan Amount |
|---|---|---|---|
| Closed | Carmichael Robert F | $130,000 | |
| Previous Owner | Carmichael Robert F | $61,000 |
Source: Public Records
Tax History
| Year | Tax Paid | Tax Assessment Tax Assessment Total Assessment is a certain percentage of the fair market value that is determined by local assessors to be the total taxable value of land and additions on the property. | Land | Improvement |
|---|---|---|---|---|
| 2025 | $11,618 | $1,096,000 | $807,700 | $288,300 |
| 2024 | $12,250 | $978,400 | $594,400 | $384,000 |
| 2023 | $12,371 | $948,700 | $594,400 | $354,300 |
| 2022 | $11,577 | $865,900 | $526,600 | $339,300 |
| 2021 | $11,283 | $865,900 | $526,600 | $339,300 |
| 2020 | $10,903 | $872,900 | $526,600 | $346,300 |
| 2019 | $10,177 | $821,400 | $479,200 | $342,200 |
| 2018 | $9,758 | $821,400 | $479,200 | $342,200 |
| 2017 | $9,249 | $777,900 | $479,200 | $298,700 |
| 2016 | $9,015 | $781,200 | $479,200 | $302,000 |
| 2015 | $8,820 | $781,200 | $479,200 | $302,000 |
| 2014 | $8,077 | $693,900 | $400,200 | $293,700 |
Source: Public Records
Map
Nearby Homes
- 701 Greendale Ave
- 168 Richdale Rd
- 26 Pinewood Rd
- 40 Otis St Unit L
- 638 Webster St
- 638 Webster St Unit 638
- 883 Greendale Ave
- 26 Gordon Rd
- 40 High St
- 143 Hunting Rd
- 19 Highland Ct Unit 19
- 7 West St
- 233 Warren St
- 68 Pleasant St Unit 68
- 5 Hazel Ln
- 1011 Webster St
- 108 Woodbine Cir
- 193 Garden St
- 447 Hillside Ave
- 97 Great Plain Ave
Your Personal Tour Guide
Ask me questions while you tour the home.