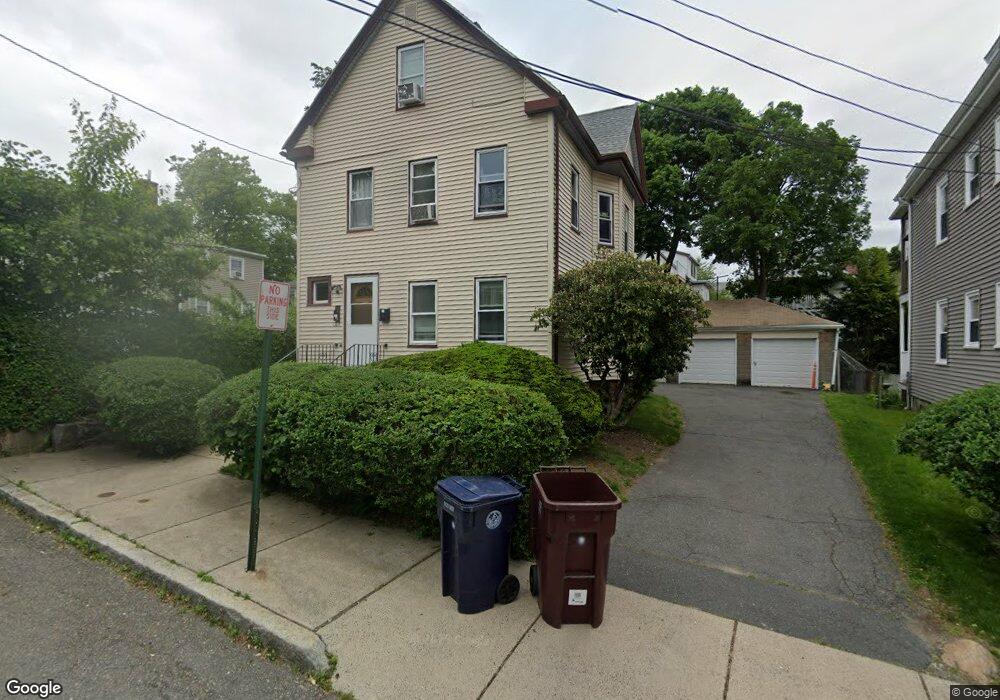
173 Jefferson Ave Everett, MA 02149
Glendale NeighborhoodEstimated Value: $670,936 - $907,000
4
Beds
2
Baths
4,574
Sq Ft
$167/Sq Ft
Est. Value
About This Home
This home is located at 173 Jefferson Ave, Everett, MA 02149 and is currently estimated at $765,984, approximately $167 per square foot. 173 Jefferson Ave is a home located in Middlesex County with nearby schools including Everett High School and Pioneer Charter School of Science.
Ownership History
Date
Name
Owned For
Owner Type
Purchase Details
Closed on
Dec 9, 2018
Sold by
Mejia Napoleon
Bought by
Napo Rt
Current Estimated Value
Purchase Details
Closed on
Apr 29, 2016
Sold by
Mejia Napoleon and Witham Joanne
Bought by
Mejia Napoleon
Purchase Details
Closed on
Jun 29, 2007
Sold by
Mejia Napoleon
Bought by
Witham Joanne and Mejia Napoleon
Home Financials for this Owner
Home Financials are based on the most recent Mortgage that was taken out on this home.
Original Mortgage
$345,000
Interest Rate
6.24%
Mortgage Type
Purchase Money Mortgage
Purchase Details
Closed on
Sep 14, 2000
Sold by
Green Kevin M and Green Paulne
Bought by
Nejia Napoleon
Home Financials for this Owner
Home Financials are based on the most recent Mortgage that was taken out on this home.
Original Mortgage
$225,100
Interest Rate
8.07%
Mortgage Type
Purchase Money Mortgage
Create a Home Valuation Report for This Property
The Home Valuation Report is an in-depth analysis detailing your home's value as well as a comparison with similar homes in the area
Home Values in the Area
Average Home Value in this Area
Purchase History
| Date | Buyer | Sale Price | Title Company |
|---|---|---|---|
| Napo Rt | -- | -- | |
| Mejia Napoleon | -- | -- | |
| Witham Joanne | -- | -- | |
| Nejia Napoleon | $237,000 | -- |
Source: Public Records
Mortgage History
| Date | Status | Borrower | Loan Amount |
|---|---|---|---|
| Previous Owner | Witham Joanne | $345,000 | |
| Previous Owner | Nejia Napoleon | $239,500 | |
| Previous Owner | Nejia Napoleon | $225,100 | |
| Previous Owner | Nejia Napoleon | $47,500 |
Source: Public Records
Tax History
| Year | Tax Paid | Tax Assessment Tax Assessment Total Assessment is a certain percentage of the fair market value that is determined by local assessors to be the total taxable value of land and additions on the property. | Land | Improvement |
|---|---|---|---|---|
| 2025 | $6,393 | $561,300 | $248,400 | $312,900 |
| 2024 | $5,901 | $514,900 | $226,200 | $288,700 |
| 2023 | $5,773 | $490,100 | $216,400 | $273,700 |
| 2022 | $4,621 | $446,000 | $191,800 | $254,200 |
| 2021 | $4,243 | $429,900 | $184,900 | $245,000 |
| 2020 | $4,489 | $421,900 | $184,900 | $237,000 |
| 2019 | $4,796 | $387,400 | $176,100 | $211,300 |
| 2018 | $4,709 | $341,700 | $153,400 | $188,300 |
| 2017 | $4,603 | $318,800 | $137,700 | $181,100 |
| 2016 | $4,136 | $286,200 | $122,900 | $163,300 |
| 2015 | $3,848 | $263,400 | $110,900 | $152,500 |
Source: Public Records
Map
Nearby Homes
- 211 Elm St
- 30 Clarence St
- 260 Elm St
- 53 Sycamore St
- 40 Glendale Ave
- 55 Garland St
- 859 Broadway Unit 15
- 881 Broadway Unit 28
- 30 Woodlawn St
- 101 Springvale Ave
- 15 Waverly Ave
- 138 Fremont Ave
- 5 Mason St
- 450 Vane St
- 114 Francis St
- 110 Ferry St
- 581 & 233 Proctor & Washington Ave
- 1 Elwood St
- 12 Hamilton St Unit 8
- 44 Walnut St
- 173 Jefferson Ave Unit 2
- 173 Jefferson Ave Unit 1
- 169 Jefferson Ave
- 167 Jefferson Ave Unit PH
- 167 Jefferson Ave Unit 2
- 167 Jefferson Ave
- 167 Jefferson Ave Unit 1
- 167 Jefferson Ave2 Unit 2
- 174 Jefferson Ave
- 165 Jefferson Ave
- 44 Calhoun Ave
- 44 Calhoun Ave Unit 3
- 46 Calhoun Ave
- 46 Calhoun Ave
- 46 Calhoun Ave Unit 3
- 46 Calhoun Ave Unit 2
- 172 Jefferson Ave
- 40 Calhoun Ave
- 00 Call Agent
- 168 Jefferson Ave
Your Personal Tour Guide
Ask me questions while you tour the home.