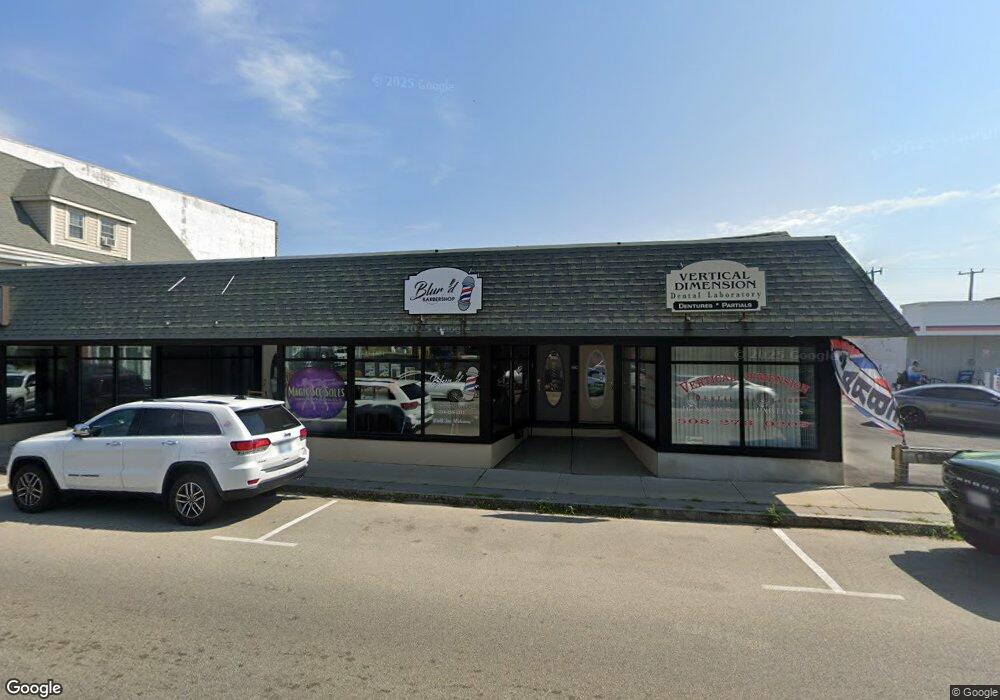
173 Main St Wareham, MA 02571
Wareham Center NeighborhoodEstimated Value: $1,043,635
4
Beds
9
Baths
400
Sq Ft
$2,609/Sq Ft
Est. Value
About This Home
This home is located at 173 Main St, Wareham, MA 02571 and is currently estimated at $1,043,635, approximately $2,609 per square foot. 173 Main St is a home located in Plymouth County.
Ownership History
Date
Name
Owned For
Owner Type
Purchase Details
Closed on
Jul 14, 2022
Sold by
Wph Nt and Hallisey
Bought by
Lopez Holdings Llc
Current Estimated Value
Home Financials for this Owner
Home Financials are based on the most recent Mortgage that was taken out on this home.
Original Mortgage
$656,250
Outstanding Balance
$622,522
Interest Rate
5.09%
Mortgage Type
Purchase Money Mortgage
Estimated Equity
$421,113
Create a Home Valuation Report for This Property
The Home Valuation Report is an in-depth analysis detailing your home's value as well as a comparison with similar homes in the area
Home Values in the Area
Average Home Value in this Area
Purchase History
| Date | Buyer | Sale Price | Title Company |
|---|---|---|---|
| Lopez Holdings Llc | $875,000 | None Available | |
| Lopez Holdings Llc | $875,000 | None Available | |
| Lopez Holdings Llc | $875,000 | None Available |
Source: Public Records
Mortgage History
| Date | Status | Borrower | Loan Amount |
|---|---|---|---|
| Open | Lopez Holdings Llc | $656,250 | |
| Closed | Lopez Holdings Llc | $656,250 |
Source: Public Records
Tax History
| Year | Tax Paid | Tax Assessment Tax Assessment Total Assessment is a certain percentage of the fair market value that is determined by local assessors to be the total taxable value of land and additions on the property. | Land | Improvement |
|---|---|---|---|---|
| 2025 | $9,001 | $863,800 | $148,800 | $715,000 |
| 2024 | $9,650 | $859,300 | $123,900 | $735,400 |
| 2023 | $9,019 | $684,300 | $123,900 | $560,400 |
| 2022 | $9,019 | $684,300 | $123,900 | $560,400 |
| 2021 | $9,204 | $684,300 | $123,900 | $560,400 |
| 2020 | $9,074 | $684,300 | $123,900 | $560,400 |
| 2019 | $8,611 | $647,900 | $118,000 | $529,900 |
| 2018 | $8,831 | $647,900 | $118,000 | $529,900 |
| 2017 | $8,714 | $647,900 | $118,000 | $529,900 |
| 2016 | $8,766 | $647,900 | $118,000 | $529,900 |
| 2015 | $8,468 | $647,900 | $118,000 | $529,900 |
| 2014 | $8,467 | $658,900 | $129,000 | $529,900 |
Source: Public Records
Map
Nearby Homes
- 12 Oakdale St
- 110 Mayflower Ridge Dr
- 437 Main St
- 1 Nimrod Way
- 10 Oak St
- 10 Longmeadow Dr
- 6 Bourne Terrace
- 2645 Cranberry Hwy Unit A
- 15 Broadmarsh Ave
- 6 Allen Ave
- 2697 Cranberry Hwy Unit 21
- 233 Marion Rd
- 20 Grant St
- 43 Shore Ave
- 2711 Cranberry Hwy
- 156 Sandwich Rd
- 2743 Cranberry Hwy Unit 5D
- 21 Bayview St
- 10 Barnes St
- 9 Woodville Way
- 177 Main St
- 173 Main St
- 175 Main St
- 187 Main St
- 189 Main St
- 181 Main St
- 191 Main St Unit LL-3
- 191 Main St Unit 104
- 191 Main St Unit 108
- 191 Main St Unit 102
- 191 Main St Unit LL-1
- 191 Main St Unit 209
- 191 Main St Unit 2nd Floor
- 191 Main St
- 191 Main St Unit 103
- 191 Main St Unit 303
- 191 Main St Unit 105
- 191 Main St Unit 106
- 191 Main St Unit 306
- 191 Main St Unit 302 &308
Your Personal Tour Guide
Ask me questions while you tour the home.