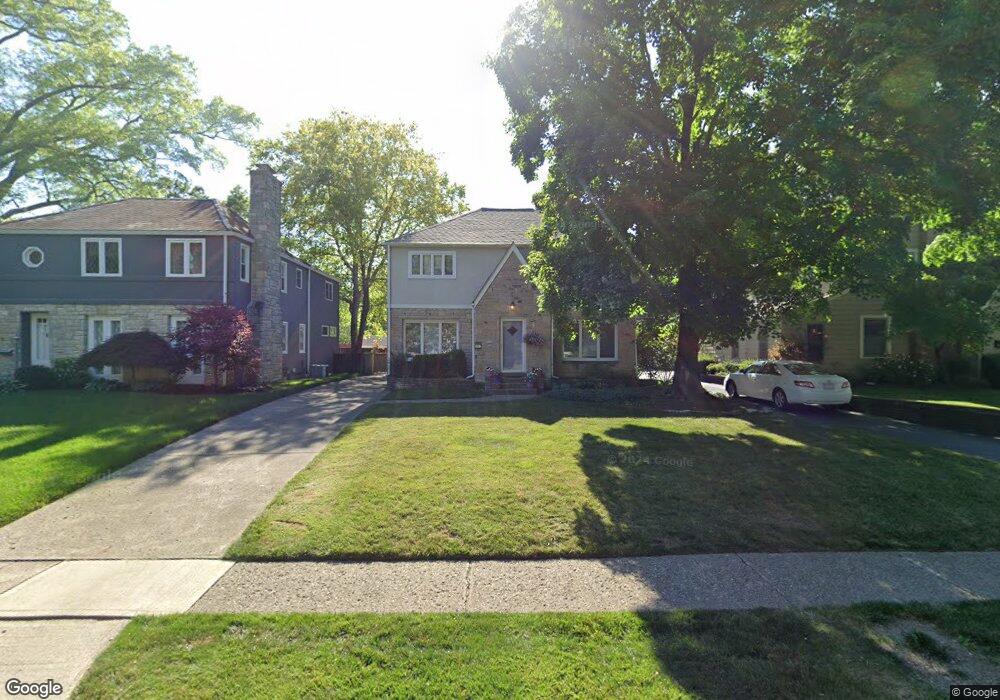
173 N Stanwood Rd Columbus, OH 43209
Estimated Value: $560,517 - $735,000
3
Beds
3
Baths
1,900
Sq Ft
$324/Sq Ft
Est. Value
About This Home
This home is located at 173 N Stanwood Rd, Columbus, OH 43209 and is currently estimated at $615,379, approximately $323 per square foot. 173 N Stanwood Rd is a home located in Franklin County with nearby schools including Maryland Elementary School, Bexley Middle School, and Bexley High School.
Ownership History
Date
Name
Owned For
Owner Type
Purchase Details
Closed on
Jul 26, 2013
Sold by
Soyle Kevin G and Getis Victoria L
Bought by
Soller Brent W and Soller Kerry L
Current Estimated Value
Home Financials for this Owner
Home Financials are based on the most recent Mortgage that was taken out on this home.
Original Mortgage
$275,700
Outstanding Balance
$201,962
Interest Rate
4.02%
Mortgage Type
Purchase Money Mortgage
Estimated Equity
$413,417
Purchase Details
Closed on
Jul 1, 2002
Sold by
Durepo Karen L and Abramson Karen D
Bought by
Boyle Kevin G and Getis Victoria L
Home Financials for this Owner
Home Financials are based on the most recent Mortgage that was taken out on this home.
Original Mortgage
$140,000
Interest Rate
6.82%
Mortgage Type
Purchase Money Mortgage
Purchase Details
Closed on
Oct 13, 2001
Sold by
Abramson Marc P
Bought by
Abramson Karen D
Purchase Details
Closed on
May 13, 1996
Sold by
Graff Francine W
Bought by
Abramson Marc and Abramson Karen D
Home Financials for this Owner
Home Financials are based on the most recent Mortgage that was taken out on this home.
Original Mortgage
$146,000
Interest Rate
7.78%
Mortgage Type
New Conventional
Create a Home Valuation Report for This Property
The Home Valuation Report is an in-depth analysis detailing your home's value as well as a comparison with similar homes in the area
Home Values in the Area
Average Home Value in this Area
Purchase History
| Date | Buyer | Sale Price | Title Company |
|---|---|---|---|
| Soller Brent W | $324,400 | None Available | |
| Boyle Kevin G | $242,400 | Amerititle | |
| Abramson Karen D | -- | Amerititle Agency Inc | |
| Abramson Marc | $162,500 | -- |
Source: Public Records
Mortgage History
| Date | Status | Borrower | Loan Amount |
|---|---|---|---|
| Open | Soller Brent W | $275,700 | |
| Closed | Boyle Kevin G | $140,000 | |
| Closed | Abramson Marc | $146,000 |
Source: Public Records
Tax History Compared to Growth
Tax History
| Year | Tax Paid | Tax Assessment Tax Assessment Total Assessment is a certain percentage of the fair market value that is determined by local assessors to be the total taxable value of land and additions on the property. | Land | Improvement |
|---|---|---|---|---|
| 2024 | $8,620 | $155,230 | $59,850 | $95,380 |
| 2023 | $7,750 | $155,225 | $59,850 | $95,375 |
| 2022 | $8,736 | $140,530 | $41,340 | $99,190 |
| 2021 | $8,743 | $140,530 | $41,340 | $99,190 |
| 2020 | $8,666 | $140,530 | $41,340 | $99,190 |
| 2019 | $8,071 | $115,150 | $34,440 | $80,710 |
| 2018 | $6,615 | $115,150 | $34,440 | $80,710 |
| 2017 | $6,522 | $115,150 | $34,440 | $80,710 |
| 2016 | $6,199 | $95,310 | $23,870 | $71,440 |
| 2015 | $6,218 | $95,310 | $23,870 | $71,440 |
| 2014 | $6,253 | $95,310 | $23,870 | $71,440 |
| 2013 | $3,250 | $95,305 | $23,870 | $71,435 |
Source: Public Records
Map
Nearby Homes
- 96 N Cassingham Rd
- 205 N Gould Rd
- 2738 E Broad St
- 49 N Cassingham Rd
- 124 N Gould Rd
- 2867 Ruhl Ave Unit 869
- 2731 E Broad St
- 2717 E Broad St
- 2779 Columbus Ave
- 50 N Broadleigh Rd
- 2629 E Broad St
- 47 N Chesterfield Rd
- 2695 Bellwood Ave
- 123 S Gould Rd
- 50 S Chesterfield Rd
- 142 S Gould Rd
- 291 N Drexel Ave
- 208 S Stanwood Rd
- 263 Edgevale Rd
- 238 Edgevale Rd
- 165 N Stanwood Rd
- 185 N Stanwood Rd
- 157 N Stanwood Rd
- 151 N Stanwood Rd
- 191 N Stanwood Rd
- 178 N Remington Rd
- 170 N Remington Rd
- 184 N Remington Rd
- 190 N Remington Rd
- 164 N Remington Rd
- 199 N Stanwood Rd
- 145 N Stanwood Rd
- 158 N Remington Rd
- 198 N Remington Rd
- 166 N Stanwood Rd
- 180 N Stanwood Rd
- 160 N Stanwood Rd
- 139 N Stanwood Rd
- 205 N Stanwood Rd
- 152 N Remington Rd